
Cellular metabolism is influenced by the stiffness of the extracellular matrix. Focal adhesion kinase (FAK) and its binding partner, p130Cas, transmit biomechanical signals, such as substrate stiffness, to the cell to regulate a variety of cellular responses, but their roles in early transcriptional and metabolic responses remain largely unexplored. We cultured mouse embryonic fibroblasts with or without siRNA-mediated FAK or p130Cas knockdown and assessed the early transcriptional responses of these cells to placement on soft and stiff substrates by RNA sequencing and bioinformatics analyses. Exposure to the stiff substrate altered the expression of genes important for metabolic and biosynthetic processes, and these responses were influenced by knockdown of FAK and p130Cas. Our findings reveal that FAK-p130Cas signaling mechanotransduces substrate stiffness to early transcriptional changes that alter cellular metabolism and biosynthesis.
© 2024 Wiley Periodicals LLC.
Product Citations: 39
FAK and p130Cas Modulate Stiffness-Mediated Early Transcription and Cellular Metabolism.
In Cytoskeleton (Hoboken, N.J.) on 1 March 2025 by Tumenbayar, B. I., Pham, K., et al.
-
Biochemistry and Molecular biology
-
Cell Biology
Abl kinases regulate FGF signaling independent of Crk phosphorylation to prevent Peters anomaly
Preprint on BioRxiv : the Preprint Server for Biology on 26 October 2024 by Wu, H., Mao, Y., et al.
Peters anomaly, the most common cause of congenital corneal opacity, stems from corneal-lenticular adhesion. Despite numerous identified mutations, a cohesive molecular framework of the disease’s etiology remains elusive. Here, we identified Abl kinases as pivotal regulators of FGF signaling, as genetic ablation of Abl kinases restores lens induction even in the absence of FGF signaling. Intriguingly, both Abl kinase deficiency and increased FGF-Ras activity result in Peters anomaly independent of ERK signaling, which can be rescued by allelic deletion of Abl substrate, Crk. However, contrary to the prevailing belief that Abl kinases regulate Crk proteins by direct phosphorylation, mutations at Abl kinase phosphorylation sites on Crk and CrkL did not yield any observable effects. Instead, our findings reveal that Abl kinases phosphorylate Ptpn12, which in turn inhibits p130Cas phosphorylation and Crk recruitment, crucial for Rho GTPases activation and cytoskeletal dynamics. Consequently, Abl kinase deficiency reduces actomyosin contractility within the lens vesicle and genetically interacts with RhoA inhibition. Conversely, Rac1 deletion mitigates Peters anomaly in models with aberrant FGF, Abl kinase and RhoA signaling. Our results demonstrate that Abl kinases regulate FGF signaling to balance RhoA and Rac1 activity via the Ptpn12-p130Cas pathway, suggesting that targeting tension-mediated lens vesicle separation could be a therapeutic strategy for Peters anomaly.
-
Mus musculus (House mouse)
FAK and p130Cas modulate stiffness-mediated early transcription and cellular metabolism
Preprint on BioRxiv : the Preprint Server for Biology on 16 January 2024 by Tumenbayar, B., Tutino, V. M., et al.
SUMMARY Cellular metabolism is influenced by the stiffness of the extracellular matrix. Focal adhesion kinase (FAK) and its binding partner, p130Cas, transmit biomechanical signals about substrate stiffness to the cell to regulate a variety of cellular responses, but their roles in early transcriptional and metabolic responses remain largely unexplored. We cultured mouse embryonic fibroblasts with or without siRNA-mediated FAK or p130Cas knockdown and assessed the early transcriptional responses of these cells to placement on soft and stiff substrates by RNA sequencing and bioinformatics analyses. Exposure to the stiff ECM altered the expression of genes important for metabolic and biosynthetic processes, and these responses were influenced by knockdown of FAK and p130Cas. Our findings reveal that FAK-p130Cas signaling mechanotransduces ECM stiffness to early transcriptional changes that alter cellular metabolism and biosynthesis.
-
Mus musculus (House mouse)
-
Biochemistry and Molecular biology
-
Cell Biology
Cas phosphorylation regulates focal adhesion assembly.
In eLife on 25 July 2023 by Kumar, S., Stainer, A., et al.
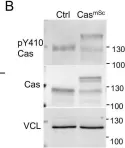
Integrin-mediated cell attachment rapidly induces tyrosine kinase signaling. Despite years of research, the role of this signaling in integrin activation and focal adhesion assembly is unclear. We provide evidence that the Src-family kinase (SFK) substrate Cas (Crk-associated substrate, p130Cas, BCAR1) is phosphorylated and associated with its Crk/CrkL effectors in clusters that are precursors of focal adhesions. The initial phospho-Cas clusters contain integrin β1 in its inactive, bent closed, conformation. Later, phospho-Cas and total Cas levels decrease as integrin β1 is activated and core focal adhesion proteins including vinculin, talin, kindlin, and paxillin are recruited. Cas is required for cell spreading and focal adhesion assembly in epithelial and fibroblast cells on collagen and fibronectin. Cas cluster formation requires Cas, Crk/CrkL, SFKs, and Rac1 but not vinculin. Rac1 provides positive feedback onto Cas through reactive oxygen, opposed by negative feedback from the ubiquitin proteasome system. The results suggest a two-step model for focal adhesion assembly in which clusters of phospho-Cas, effectors and inactive integrin β1 grow through positive feedback prior to integrin activation and recruitment of core focal adhesion proteins.
© 2023, Kumar et al.
-
WB
-
Homo sapiens (Human)
Phosphorylation of tyrosine 90 in SH3 domain is a new regulatory switch controlling Src kinase.
In eLife on 10 July 2023 by Koudelková, L., Pelantová, M., et al.
The activation of Src kinase in cells is strictly controlled by intramolecular inhibitory interactions mediated by SH3 and SH2 domains. They impose structural constraints on the kinase domain holding it in a catalytically non-permissive state. The transition between inactive and active conformation is known to be largely regulated by the phosphorylation state of key tyrosines 416 and 527. Here, we identified that phosphorylation of tyrosine 90 reduces binding affinity of the SH3 domain to its interacting partners, opens the Src structure, and renders Src catalytically active. This is accompanied by an increased affinity to the plasma membrane, decreased membrane motility, and slower diffusion from focal adhesions. Phosphorylation of tyrosine 90 controlling SH3-medited intramolecular inhibitory interaction, analogical to tyrosine 527 regulating SH2-C-terminus bond, enables SH3 and SH2 domains to serve as cooperative but independent regulatory elements. This mechanism allows Src to adopt several distinct conformations of varying catalytic activities and interacting properties, enabling it to operate not as a simple switch but as a tunable regulator functioning as a signalling hub in a variety of cellular processes.
© 2023, Koudelková et al.
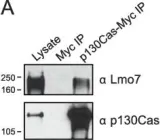
In Elife on 25 July 2023 by Kumar, S., Stainer, A., et al.
Fig.1.B

-
WB
-
Homo sapiens (Human)
Collected and cropped from Elife by CiteAb, provided under a CC-BY license
Image 1 of 9
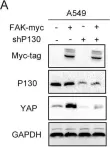
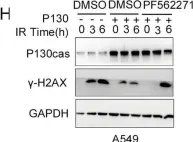
In Cell Death Dis on 10 September 2022 by Li, J., Zhang, X., et al.
Fig.3.H

-
WB
-
Collected and cropped from Cell Death Dis by CiteAb, provided under a CC-BY license
Image 1 of 9
In Cell Death Dis on 10 September 2022 by Li, J., Zhang, X., et al.
Fig.4.A

-
WB
-
Collected and cropped from Cell Death Dis by CiteAb, provided under a CC-BY license
Image 1 of 9
In Cell Death Dis on 10 September 2022 by Li, J., Zhang, X., et al.
Fig.4.H

-
WB
-
Collected and cropped from Cell Death Dis by CiteAb, provided under a CC-BY license
Image 1 of 9
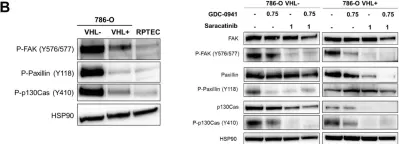
In Oncotarget on 10 July 2018 by Roelants, C., Giacosa, S., et al.
Fig.2.B

-
WB
-
Collected and cropped from Oncotarget by CiteAb, provided under a CC-BY license
Image 1 of 9
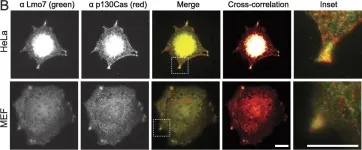
In PeerJ on 7 September 2013 by Wozniak, M. A., Baker, B. M., et al.
Fig.3.A

-
WB
-
Homo sapiens (Human)
Collected and cropped from PeerJ by CiteAb, provided under a CC-BY license
Image 1 of 9
In PeerJ on 7 September 2013 by Wozniak, M. A., Baker, B. M., et al.
Fig.3.B

-
ICC-IF
-
Homo sapiens (Human)
Collected and cropped from PeerJ by CiteAb, provided under a CC-BY license
Image 1 of 9
In PeerJ on 7 September 2013 by Wozniak, M. A., Baker, B. M., et al.
Fig.3.C

-
ICC-IF
-
Homo sapiens (Human)
Collected and cropped from PeerJ by CiteAb, provided under a CC-BY license
Image 1 of 9
In Breast Cancer Res on 28 February 2012 by Lahlou, H., Sanguin-Gendreau, V., et al.
Fig.4.A

-
WB
-
Collected and cropped from Breast Cancer Res by CiteAb, provided under a CC-BY license
Image 1 of 9