


The sustainability of vascular access for hemodialysis is limited by frequent interventions and the inability of synthetic grafts to self-heal. Tissue engineering offers a solution through biodegradable grafts that remodel into autologous tissue. Here we assess electrospun polycarbonate-bis urea (PC-BU) vascular scaffolds (6mm-inner-Ø), reinforced with 3D-printed polycaprolactone coils, in a goat model, and compared them to expanded polytetrafluoroethylene (ePTFE) controls. The tissue-engineered grafts were repeatedly cannulated starting two weeks after implantation and were evaluated using computed tomography and histological analyses. By 12 weeks, the PC-BU grafts remodel into autologous tissue while maintaining structural integrity, maintaining integrity without dilations, ruptures, or aneurysms. Cannulation does not interfere with scaffold degradation or neo-tissue formation. Although the patency rate is lower for the PC-BU grafts (50%) compared to ePTFE (100%), the engineered grafts exhibit a self-healing response not seen in ePTFE. These findings demonstrate the potential of PC-BU tissue-engineered grafts as healing, functional vascular access solutions for hemodialysis, supporting cannulation during tissue transformation.
© The Author(s) 2025.
Product Citations: 262
In Communications Materials on 21 July 2025 by Besseling, P. J., Szymczyk, W., et al.
-
IHC-P
-
Capra aegagrus hircus (Goat)
Immune-mediated regeneration of cell-free vascular grafts in an ovine model.
In Npj Regenerative Medicine on 19 March 2025 by Nasiri, B., Das, A., et al.
We developed acellular tissue engineered vessels (ATEV) using small intestine submucosa (SIS) incorporating heparin and a novel protein named H2R5. ATEVs were implanted into the arterial circulation of an ovine animal model, demonstrating high primary patency rates over a period of three months. Implanted grafts were infiltrated by host cells, the majority of which were monocytes/macrophages (MC/MΦ), as demonstrated by scRNA sequencing and immunostaining. They also developed functional endothelial and medial layers that deposited new extracellular matrix leading to matrix remodeling and acquisition of mechanical properties that were similar to those of native arteries. Notably, during this short implantation time, ATEVs turned into functional neo-arteries, as evidenced by the development of the vascular contractile function. Our findings underscore the potential of H2R5-functionalized ATEVs as promising candidates for tissue replacement grafts in a large pre-clinical animal model and highlight the contribution of macrophages in vascular regeneration.
© 2025. The Author(s).
-
IHC
-
Immunology and Microbiology
-
Veterinary Research
In Molecular Biology Reports on 13 March 2025 by Burger, M. L., Menétrey, S., et al.
Regulation of the human umbilical circulation under physiological and pathological conditions remains poorly understood. We previously demonstrated that intrauterine growth restriction (IUGR) is associated with sex-specific alterations in the human umbilical circulation. Our data strongly suggest a differential contribution of subcellular compartmentation depending on fetal sex, vessel type and the presence of IUGR. We therefore developed a protocol to isolate and culture umbilical vascular cells to further investigate the relative contribution of each cell type and subcellular compartmentation to the human umbilical circulation regulation.
Human umbilical cords and cord blood were collected just after delivery. Mononuclear cells were recovered from cord blood using a Ficoll gradient and cultured to obtain endothelial colony-forming cells (ECFCs). Endothelial cells (ECs) were isolated from human umbilical vein (HUV) and arteries (HUAs) by collagenase/dispase digestion, and vascular smooth muscle cells (SMCs) by migration from vascular explants. All cell types were characterized by visualization, and by analysis of biomarkers using immunocytofluorescence and Western blot. ECFCs were also submitted to polychromatic flow cytometry analysis.
This protocol enables simultaneous isolation and culture of ECFCs, HUVECs, HUAECs, HUVSMCs and HUASMCs from the same umbilical cord. It is simpler, faster and more cost-effective than other previously published methods, with good success rates. This will be helpful to further investigate the regulatory mechanisms implicated in the human umbilical circulation under physiological and pathological conditions and to study the influence of fetal sex.
© 2025. The Author(s).
-
WB
-
Biochemistry and Molecular biology
In Cardiovascular Diabetology on 7 February 2025 by Grootaert, M. O. J., Pasut, A., et al.
Heart failure with preserved ejection fraction (HFpEF) is a complex cardiovascular disease associated with metabolic comorbidities. Microvascular dysfunction has been proposed to drive HFpEF, likely via endothelial cell (EC) dysfunction, yet the role of the mural cells herein has never been explored.
We used the diabetic db/db mouse given 1% salt as a new model of HFpEF and crossed then with PDGFRβtg/tg-CreERT2-EYFPtg/tg mice to label the mural cells. We combined single-cell RNA sequencing, NichetNet analysis and histology to determine the role of mural cell dysfunction in HFpEF.
Db/db mice given 1% salt for 8 weeks developed diastolic dysfunction preceded by capillary density loss, pericyte loss and vessel regression. At 4 weeks of salt, hearts of db/db mice already showed EC dysfunction associated with an anti-angiogenic signature, and an increase in pericyte-EC intracellular space. Db/db + salt hearts were further characterised by increased ACTA2 expression, arteriole wall thickening and vessel enlargement. NicheNet analysis on the single cell transcriptomic data revealed little signalling from the ECs to the mural cells; instead, mural cells signalled strongly to ECs. Mechanistically, pericyte dysfunction induces an EC growth arrest via TNFα-dependent paracrine signalling and downstream signalling through STAT1.
Mural cell dysfunction contributes to HFpEF by inducing coronary vessel remodelling, at least in part by reducing EC proliferation and inducing EC inflammation through TNFα-dependent paracrine signalling.
© 2025. The Author(s).
-
Cardiovascular biology
In International Journal of Molecular Sciences on 5 February 2025 by Tovilović-Kovačević, G., Zogović, N., et al.
Endothelial dysfunction is an early pathophysiological event in atherosclerosis. The endothelial-protective abilities of diethylether extract (EE) from the Gentiana kochiana (Gentianaceae) herb and its main component, xanthone aglycone gentiacaulein (GC), were evaluated in an oxidized low-density lipoprotein (oxLDL)-treated EA.hy926 endothelial cell line. The EE and GC actions were assessed using cell viability assays, flow cytometry, immunoblot, DPPH, NBT, TBARS, conjugated diene formation, and Griess tests. Both EE and GC prevented oxLDL-induced apoptosis by reducing intracellular reactive oxygen species levels, mitochondrial depolarization, and caspase activation in EA.hy926 cells. EE and GC dose-dependently diminished oxLDL-induced cellular lipid peroxidation. In cell-free conditions, EE moderately scavenged superoxide anions and had no affinity toward DPPH radicals, GC did not interact with either of investigated free radicals, while both EE and GC effectively delayed Cu²⁺-induced LDL oxidation. EE and GC upregulated oxLDL-suppressed protective Akt/CREB/eNOS and ERK signals and restored oxLDL-reduced nitric oxide levels. Therefore, EE and GC effectively counteract oxLDL-induced endothelial apoptosis by reducing oxidative stress, promoting mitochondrial recovery, and enhancing the prosurvival Akt/CREB/eNOS axis and ERK activity. Our study is the first to demonstrate that xanthone-rich EE from aerial parts of G. kochiana and xanthone GC alleviate oxLDL-induced endothelial cell injury, underscoring their potential for cardiovascular protection.
-
WB
-
Homo sapiens (Human)
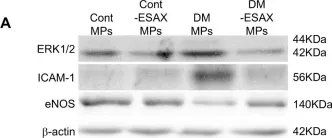
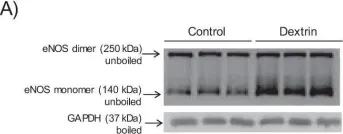
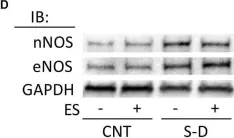
In Sci Rep on 1 November 2024 by Taguchi, K., Kondo, H., et al.
Fig.4.A

-
WB
-
Mus musculus (House mouse)
Collected and cropped from Sci Rep by CiteAb, provided under a CC-BY license
Image 1 of 36
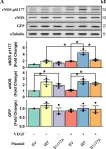
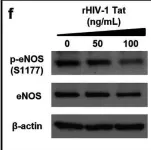
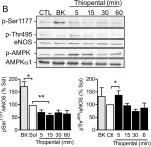
In PLoS One on 11 July 2024 by Yuan, S. & Straub, A. C.
Fig.5.A

-
WB
-
Collected and cropped from PLoS One by CiteAb, provided under a CC-BY license
Image 1 of 36
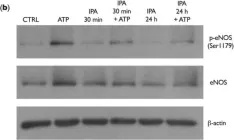
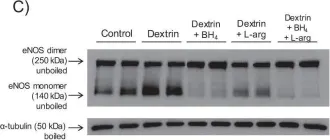
In Int J Mol Sci on 16 March 2024 by Geddo, F., Antoniotti, S., et al.
Fig.5.B

-
WB
-
Collected and cropped from Int J Mol Sci by CiteAb, provided under a CC-BY license
Image 1 of 36
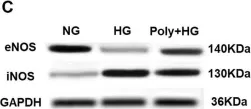
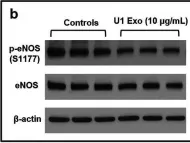
In Sci Rep on 2 October 2023 by Shah, W., Zhao, Q., et al.
Fig.2.C

-
WB
-
Collected and cropped from Sci Rep by CiteAb, provided under a CC-BY license
Image 1 of 36
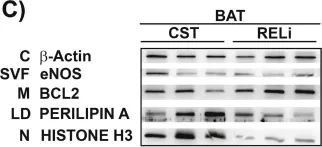
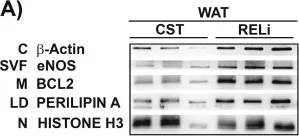
In Redox Biol on 1 May 2023 by López-Soldado, I., Torres, A. G., et al.
Fig.6.C

-
WB
-
Collected and cropped from Redox Biol by CiteAb, provided under a CC-BY license
Image 1 of 36
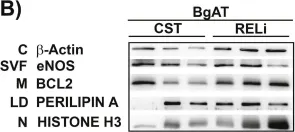
In Redox Biol on 1 May 2023 by López-Soldado, I., Torres, A. G., et al.
Fig.6.D

-
WB
-
Collected and cropped from Redox Biol by CiteAb, provided under a CC-BY license
Image 1 of 36
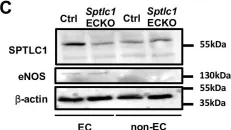
In Elife on 5 October 2022 by Kuo, A., Checa, A., et al.
Fig.1.A

-
WB
-
Collected and cropped from Elife by CiteAb, provided under a CC-BY license
Image 1 of 36
In Elife on 5 October 2022 by Kuo, A., Checa, A., et al.
Fig.1.C

-
WB
-
Collected and cropped from Elife by CiteAb, provided under a CC-BY license
Image 1 of 36
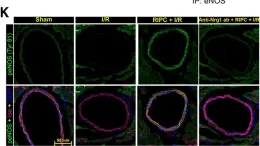
In Arterioscler Thromb Vasc Biol on 1 August 2021 by Kundumani-Sridharan, V., Subramani, J., et al.
Fig.2.K

-
IHC-IF
-
Homo sapiens (Human)
Collected and cropped from Arterioscler Thromb Vasc Biol by CiteAb, provided under a CC-BY license
Image 1 of 36
In Mol Neurobiol on 1 June 2021 by Chandra, P. K., Rutkai, I., et al.
Fig.6.B

-
WB
-
Collected and cropped from Mol Neurobiol by CiteAb, provided under a CC-BY license
Image 1 of 36
In Mol Neurobiol on 1 June 2021 by Chandra, P. K., Rutkai, I., et al.
Fig.6.T

-
WB
-
Collected and cropped from Mol Neurobiol by CiteAb, provided under a CC-BY license
Image 1 of 36
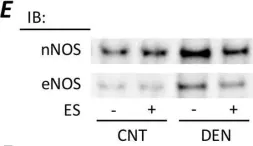
In Physiol Rep on 1 July 2020 by Singh, S., Nguyen, H., et al.
Fig.5.D

-
WB
-
Collected and cropped from Physiol Rep by CiteAb, provided under a CC-BY license
Image 1 of 36
In Sci Rep on 5 February 2020 by Langer, H. T., Afzal, S., et al.
Fig.3.C

-
WB
-
Collected and cropped from Sci Rep by CiteAb, provided under a CC-BY license
Image 1 of 36
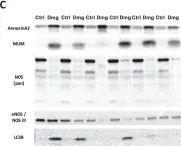
In PLoS One on 10 October 2019 by Yamada, T., Ashida, Y., et al.
Fig.4.E

-
WB
-
Collected and cropped from PLoS One by CiteAb, provided under a CC-BY license
Image 1 of 36
In J Biol Chem on 26 July 2019 by Pestoni, J. C., Klingeman Plati, S., et al.
Fig.1.E

-
WB
-
Collected and cropped from J Biol Chem by CiteAb, provided under a CC-BY license
Image 1 of 36
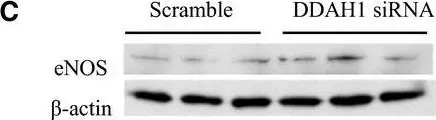
In Physiol Rep on 1 July 2019 by Trittmann, J. K., Almazroue, H., et al.
Fig.1.C

-
WB
-
Homo sapiens (Human)
Collected and cropped from Physiol Rep by CiteAb, provided under a CC-BY license
Image 1 of 36
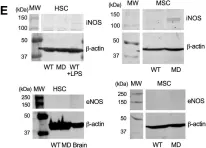
In MethodsX on 14 May 2019 by Diaz Marin, R., Crespo-Garcia, S., et al.
Fig.4.C

-
WB
-
Mus musculus (House mouse)
Collected and cropped from MethodsX by CiteAb, provided under a CC-BY license
Image 1 of 36
In MethodsX on 14 May 2019 by Diaz Marin, R., Crespo-Garcia, S., et al.
Fig.4.B

-
WB
-
Mus musculus (House mouse)
Collected and cropped from MethodsX by CiteAb, provided under a CC-BY license
Image 1 of 36
In MethodsX on 14 May 2019 by Diaz Marin, R., Crespo-Garcia, S., et al.
Fig.4.A

-
WB
-
Mus musculus (House mouse)
Collected and cropped from MethodsX by CiteAb, provided under a CC-BY license
Image 1 of 36
In Sci Rep on 30 April 2019 by Potje, S. R., Grando, M. D., et al.
Fig.8.A

-
WB
-
Collected and cropped from Sci Rep by CiteAb, provided under a CC-BY license
Image 1 of 36
In Sci Rep on 30 April 2019 by Potje, S. R., Grando, M. D., et al.
Fig.8.C

-
WB
-
Collected and cropped from Sci Rep by CiteAb, provided under a CC-BY license
Image 1 of 36
In Front Physiol on 9 January 2019 by Monsalvo-Villegas, A., Osornio-Garduño, D. S., et al.
Fig.7.B

-
WB
-
Rattus norvegicus (Rat)
Collected and cropped from Front Physiol by CiteAb, provided under a CC-BY license
Image 1 of 36
In Int J Mol Sci on 13 September 2018 by Zippel, N., Loot, A. E., et al.
Fig.5.B

-
WB
-
Collected and cropped from Int J Mol Sci by CiteAb, provided under a CC-BY license
Image 1 of 36
In Front Physiol on 28 August 2018 by Yamada, T., Himori, K., et al.
Fig.6.D

-
WB
-
Rattus norvegicus (Rat)
Collected and cropped from Front Physiol by CiteAb, provided under a CC-BY license
Image 1 of 36
In Front Physiol on 28 August 2018 by Yamada, T., Himori, K., et al.
Fig.6.A

-
WB
-
Rattus norvegicus (Rat)
Collected and cropped from Front Physiol by CiteAb, provided under a CC-BY license
Image 1 of 36