The acidic tumor microenvironment (TME) favors cancer aggressiveness via incompletely understood pathways. Here, we asked whether adaptation to environmental acidosis (pH 6.5) selects for human pancreatic cancer stem cell (CSC) properties. RNA sequencing (RNA-seq) of acid-adapted (AA) Panc-1 cells revealed CSC pathway enrichment and upregulation of CSC markers. AA Panc-1 cells exhibited classical CSC characteristics including increased aldehyde dehydrogenase (ALDH) activity and β-catenin activity. Panc-1, PaTu8988s, and MiaPaCa-2 cells all exhibited increased pancreatosphere-forming efficiency after acid adaptation but differed in CSC marker expression and did not exhibit typical flow cytometric CSC populations. However, single-nucleus sequencing revealed the acid adaptation-induced emergence of Panc-1 cell subpopulations with clear CSC characteristics. In orthotopic mouse tumors, AA Panc-1 cells exhibited enhanced aggressiveness, liver and lung metastasis, compared to controls. Collectively, our work suggests that acid adaptation enriches for pancreatic CSC phenotypes with unusual traits via several trajectories, providing new insight into how acidic microenvironments favor cancer aggressiveness.
© 2025 The Author(s).
Product Citations: 75
In IScience on 21 March 2025 by Rolver, M. G., Camacho-Roda, J., et al.
-
Cancer Research
-
Stem Cells and Developmental Biology
Cell adhesion and spreading on fluid membranes through microtubules-dependent mechanotransduction.
In Nature Communications on 31 January 2025 by Mikhajlov, O., Adar, R. M., et al.
Integrin clusters facilitate mechanical force transmission (mechanotransduction) and regulate biochemical signaling during cell adhesion. However, most studies have focused on rigid substrates. On fluid substrates like supported lipid bilayers (SLBs), integrin ligands are mobile, and adhesive complexes are traditionally thought unable to anchor for cell spreading. Here, we demonstrate that cells spread on SLBs coated with Invasin, a high-affinity integrin ligand. Unlike SLBs functionalized with RGD peptides, integrin clusters on Invasin-SLBs grow in size and complexity comparable to those on glass. While actomyosin contraction dominates adhesion maturation on stiff substrates, we find that on fluid SLBs, integrin mechanotransduction and cell spreading rely on dynein pulling forces along microtubules perpendicular to the membranes and microtubules pushing on adhesive complexes, respectively. These forces, potentially present on non-deformable surfaces, are revealed in fluid substrate systems. Supported by a theoretical model, our findings demonstrate a mechanical role for microtubules in integrin clustering.
© 2025. The Author(s).
NuMA mechanically reinforces the spindle independently of its partner dynein
Preprint on BioRxiv : the Preprint Server for Biology on 1 December 2024 by Cho, N. H., Aslan, M., et al.
ABSTRACT Both motor and non-motor proteins organize microtubules to build the spindle and maintain it against opposing forces. NuMA, a long microtubule binding protein, is essential to spindle structure and function. NuMA recruits the motor dynein to spindle microtubule minus-ends to actively cluster them, but whether NuMA performs other spindle roles remains unknown. Here, we show that NuMA acts independently of dynein to passively reinforce the mammalian spindle. NuMA that cannot bind dynein is sufficient to protect spindle poles against fracture under external force. In contrast, NuMA with a shorter coiled-coil or disrupted self-interactions cannot protect spindle poles, and NuMA turnover differences cannot explain mechanical differences. In vitro , NuMA’s C-terminus self-interacts and bundles microtubules without dynein, dependent on residues essential to pole protection in vivo . Together, this suggests that NuMA reinforces spindle poles by crosslinking microtubules, using its long coiled-coiled and self-interactions to reach multiple, far-reaching pole microtubules. We propose that NuMA acts as a mechanical “multitasker” targeting contractile motor activity and separately crosslinking microtubules, both functions synergizing to drive spindle mechanical robustness.
Systems mapping of bidirectional endosomal transport through the crowded cell.
In Current Biology : CB on 7 October 2024 by Jongsma, M. L. M., Bakker, N., et al.
Kinesin and dynein-dynactin motors move endosomes and other vesicles bidirectionally along microtubules, a process mainly studied under in vitro conditions. Here, we provide a physiological bidirectional transport model following color-coded, endogenously tagged transport-related proteins as they move through a crowded cellular environment. Late endosomes (LEs) surf bidirectionally on Protrudin-enriched endoplasmic reticulum (ER) membrane contact sites, while hopping and gliding along microtubules and bypassing cellular obstacles, such as mitochondria. During bidirectional transport, late endosomes do not switch between opposing Rab7 GTPase effectors, RILP and FYCO1, or their associated dynein and KIF5B motor proteins, respectively. In the endogenous setting, far fewer motors associate with endosomal membranes relative to effectors, implying coordination of transport with other aspects of endosome physiology through GTPase-regulated mechanisms. We find that directionality of transport is provided in part by various microtubule-associated proteins (MAPs), including MID1, EB1, and CEP169, which recruit Lis1-activated dynein motors to microtubule plus ends for transport of early and late endosomal populations. At these microtubule plus ends, activated dynein motors encounter the dynactin subunit p150glued and become competent for endosomal capture and minus-end movement in collaboration with membrane-associated Rab7-RILP. We show that endosomes surf over the ER through the crowded cell and move bidirectionally under the control of MAPs for motor activation and through motor replacement and capture by endosomal anchors.
Copyright © 2024 The Author(s). Published by Elsevier Inc. All rights reserved.
-
Homo sapiens (Human)
-
Cell Biology
Apache is a neuronal player in autophagy required for retrograde axonal transport of autophagosomes.
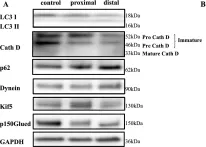
In Cellular and Molecular Life Sciences : CMLS on 5 October 2024 by Parisi, B., Esposito, A., et al.
Neurons are dependent on efficient quality control mechanisms to maintain cellular homeostasis and function due to their polarization and long-life span. Autophagy is a lysosomal degradative pathway that provides nutrients during starvation and recycles damaged and/or aged proteins and organelles. In neurons, autophagosomes constitutively form in distal axons and at synapses and are trafficked retrogradely to the cell soma to fuse with lysosomes for cargo degradation. How the neuronal autophagy pathway is organized and controlled remains poorly understood. Several presynaptic endocytic proteins have been shown to regulate both synaptic vesicle recycling and autophagy. Here, by combining electron, fluorescence, and live imaging microscopy with biochemical analysis, we show that the neuron-specific protein APache, a presynaptic AP-2 interactor, functions in neurons as an important player in the autophagy process, regulating the retrograde transport of autophagosomes. We found that APache colocalizes and co-traffics with autophagosomes in primary cortical neurons and that induction of autophagy by mTOR inhibition increases LC3 and APache protein levels at synaptic boutons. APache silencing causes a blockade of autophagic flux preventing the clearance of p62/SQSTM1, leading to a severe accumulation of autophagosomes and amphisomes at synaptic terminals and along neurites due to defective retrograde transport of TrkB-containing signaling amphisomes along the axons. Together, our data identify APache as a regulator of the autophagic cycle, potentially in cooperation with AP-2, and hypothesize that its dysfunctions contribute to the early synaptic impairments in neurodegenerative conditions associated with impaired autophagy.
© 2024. The Author(s).
-
Biochemistry and Molecular biology
-
Cell Biology
In Acta Neuropathol Commun on 29 May 2024 by Luo, X., Zhang, J., et al.
Fig.4.A

-
WB
-
Collected and cropped from Acta Neuropathol Commun by CiteAb, provided under a CC-BY license
Image 1 of 30
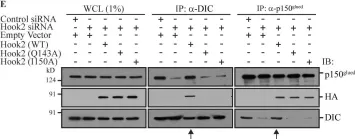
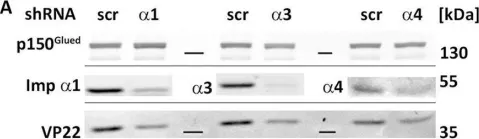
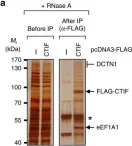
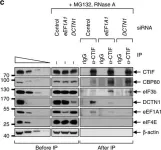
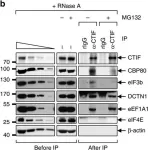
In Nat Commun on 6 October 2023 by Hwang, H. J., Park, T. L., et al.
Fig.8.A

-
WB
-
Homo sapiens (Human)
Collected and cropped from Nat Commun by CiteAb, provided under a CC-BY license
Image 1 of 30
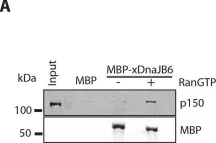
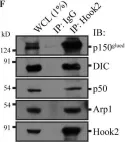
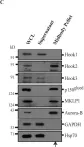
In Nat Commun on 28 July 2021 by Fenton, A. R., Jongens, T. A., et al.
Fig.4.H

-
WB
-
Collected and cropped from Nat Commun by CiteAb, provided under a CC-BY license
Image 1 of 30
In J Cell Sci on 15 May 2021 by Majstrowicz, K., Honnert, U., et al.
Fig.3.D

-
WB
-
Collected and cropped from J Cell Sci by CiteAb, provided under a CC-BY license
Image 1 of 30
In J Cell Sci on 3 June 2019 by Rosas-Salvans, M., Scrofani, J., et al.
Fig.6.A

-
WB
-
Collected and cropped from J Cell Sci by CiteAb, provided under a CC-BY license
Image 1 of 30
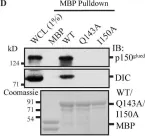
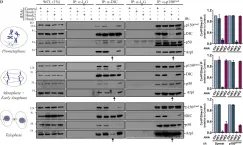
In J Cell Biol on 4 March 2019 by Dwivedi, D., Kumari, A., et al.
Fig.1.D

-
WB
-
Homo sapiens (Human)
Collected and cropped from J Cell Biol by CiteAb, provided under a CC-BY license
Image 1 of 30
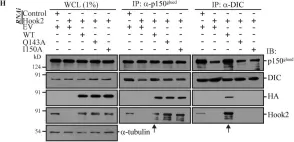
In J Cell Biol on 4 March 2019 by Dwivedi, D., Kumari, A., et al.
Fig.1.H

-
WB
-
Homo sapiens (Human)
Collected and cropped from J Cell Biol by CiteAb, provided under a CC-BY license
Image 1 of 30
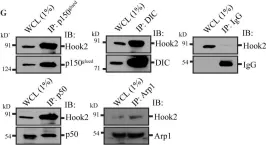
In J Cell Biol on 4 March 2019 by Dwivedi, D., Kumari, A., et al.
Fig.1.G

-
WB
-
Homo sapiens (Human)
Collected and cropped from J Cell Biol by CiteAb, provided under a CC-BY license
Image 1 of 30
In J Cell Biol on 4 March 2019 by Dwivedi, D., Kumari, A., et al.
Fig.1.F

-
WB
-
Homo sapiens (Human)
Collected and cropped from J Cell Biol by CiteAb, provided under a CC-BY license
Image 1 of 30
In J Cell Biol on 4 March 2019 by Dwivedi, D., Kumari, A., et al.
Fig.2.E

-
WB
-
Homo sapiens (Human)
Collected and cropped from J Cell Biol by CiteAb, provided under a CC-BY license
Image 1 of 30
In J Cell Biol on 4 March 2019 by Dwivedi, D., Kumari, A., et al.
Fig.2.D

-
WB
-
Homo sapiens (Human)
Collected and cropped from J Cell Biol by CiteAb, provided under a CC-BY license
Image 1 of 30
In J Cell Biol on 4 March 2019 by Dwivedi, D., Kumari, A., et al.
Fig.2.A

-
WB
-
Homo sapiens (Human)
Collected and cropped from J Cell Biol by CiteAb, provided under a CC-BY license
Image 1 of 30
In J Cell Biol on 4 March 2019 by Dwivedi, D., Kumari, A., et al.
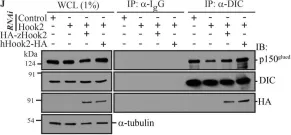
Fig.9.J

-
WB
-
Homo sapiens (Human)
Collected and cropped from J Cell Biol by CiteAb, provided under a CC-BY license
Image 1 of 30
In J Cell Biol on 4 March 2019 by Dwivedi, D., Kumari, A., et al.
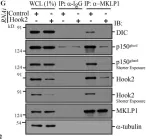
Fig.9.G

-
WB
-
Homo sapiens (Human)
Collected and cropped from J Cell Biol by CiteAb, provided under a CC-BY license
Image 1 of 30
In J Cell Biol on 4 March 2019 by Dwivedi, D., Kumari, A., et al.
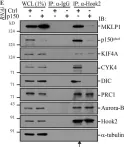
Fig.9.E

-
WB
-
Homo sapiens (Human)
Collected and cropped from J Cell Biol by CiteAb, provided under a CC-BY license
Image 1 of 30
In J Cell Biol on 4 March 2019 by Dwivedi, D., Kumari, A., et al.
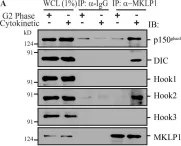
Fig.9.A

-
WB
-
Homo sapiens (Human)
Collected and cropped from J Cell Biol by CiteAb, provided under a CC-BY license
Image 1 of 30
In J Cell Biol on 4 March 2019 by Dwivedi, D., Kumari, A., et al.
Fig.8.C

-
WB
-
Homo sapiens (Human)
Collected and cropped from J Cell Biol by CiteAb, provided under a CC-BY license
Image 1 of 30
In PLoS Pathog on 1 January 2018 by Döhner, K., Ramos-Nascimento, A., et al.
Fig.6.A

-
WB
-
Collected and cropped from PLoS Pathog by CiteAb, provided under a CC-BY license
Image 1 of 30
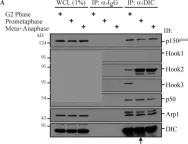
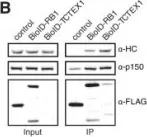
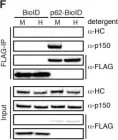
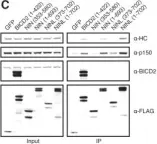
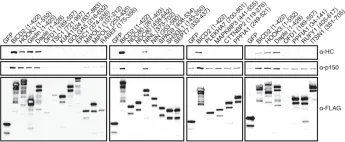
In Elife on 18 July 2017 by Redwine, W. B., DeSantis, M. E., et al.
Fig.3.B

-
WB
-
Homo sapiens (Human)
Collected and cropped from Elife by CiteAb, provided under a CC-BY license
Image 1 of 30
In Elife on 18 July 2017 by Redwine, W. B., DeSantis, M. E., et al.
Fig.1.F

-
WB
-
Homo sapiens (Human)
Collected and cropped from Elife by CiteAb, provided under a CC-BY license
Image 1 of 30
In Elife on 18 July 2017 by Redwine, W. B., DeSantis, M. E., et al.
Fig.4.C

-
WB
-
Homo sapiens (Human)
Collected and cropped from Elife by CiteAb, provided under a CC-BY license
Image 1 of 30
In Elife on 18 July 2017 by Redwine, W. B., DeSantis, M. E., et al.
Fig.4.A

-
WB
-
Homo sapiens (Human)
Collected and cropped from Elife by CiteAb, provided under a CC-BY license
Image 1 of 30
In Nat Commun on 7 June 2017 by Park, J., Park, Y., et al.
Fig.2.A

-
WB
-
Homo sapiens (Human)
Collected and cropped from Nat Commun by CiteAb, provided under a CC-BY license
Image 1 of 30
In Nat Commun on 7 June 2017 by Park, J., Park, Y., et al.
Fig.2.C

-
WB
-
Homo sapiens (Human)
Collected and cropped from Nat Commun by CiteAb, provided under a CC-BY license
Image 1 of 30
In Nat Commun on 7 June 2017 by Park, J., Park, Y., et al.
Fig.2.B

-
WB
-
Homo sapiens (Human)
Collected and cropped from Nat Commun by CiteAb, provided under a CC-BY license
Image 1 of 30