Metastatic prostate cancer occurs when the tumor spreads from the prostate gland to other parts of the body. Previous studies have shown that Gαi2, a subunit of the heterotrimeric G protein complex, plays a critical role in inducing cell migration and invasion in prostate cancer cells in response to diverse stimuli. Rac1 is a small rho-GTPase, which is activated by the phosphoinositide 3-kinase (PI3K)/AKT pathway and plays an essential role during cell migration. Previous studies have shown that the knockdown of Gαi2 attenuates cell migration without causing any reduction in basal Rac1 activity in both PC3 and DU145 cells, and has only marginal effects on the epidermal growth facotor (EGF)-induced increase in Rac1 activity. Therefore, Gαi2 may be involved in the regulation of cell motility and invasion independently or downstream of Rac1 activation. In this study, we investigated the possible mechanism of Gαi2 at the level of the Rac1-dependent activation of Wiskott-Aldrich Syndrome Protein)-family verprolin homologous protein2 (Wave2) and actin related protein 2/3 (Arp 2/3) proteins, downstream effectors of activated Rac1. PC3 cells with a stable overexpression of constitutively active Rac1 were transfected with control siRNA or Gαi2 siRNA to knockdown endogenous Gαi2 expression. Western blot analysis showed that the Rac1-dependent activation of Wave2 was impaired in the absence of Gαi2. The overexpression of constitutively active Gαi2 (Gαi2-Q205L) in PC3 cells significantly increased cell migration compared to cells transfected with control plasmids. In the parallel experiments, a specific Gαi2 inhibitor blocked Giα2-Q205L-induced cell migration in PC3 cells. Furthermore, the Rac1 inhibitor did not block increased cell migration in PC3 cells overexpressing constitutively active Gαi2. We conclude that activated Gαi2 plays a crucial role in cell migration in prostate cancer cells independent of Rac1 activation.
Product Citations: 237
Gαi2 Induces Cell Migration in PC3 Prostate Cancer Cells in the Absence of Rac1 Activation.
In International Journal of Molecular Sciences on 15 March 2025 by Johnson, R., Caggia, S., et al.
-
Cancer Research
Preprint on BioRxiv : the Preprint Server for Biology on 13 January 2025 by Korpela, S., Kauppila, M., et al.
Retinal pigment epithelium (RPE) is an epithelial monolayer located at the back of the eye underneath the neural retina. RPE and retina interact closely, with RPE performing multiple tasks to ensure proper retinal physiology and forming a tight, interlocked structure with photoreceptor outer segments (POS). Essential for retinal welfare, RPE enables the daily renewal of POS by phagocytosing their aged tips. Current RPE in vitro cell culture systems lack the contact between RPE and retina, possibly limiting not only RPE maturation but also hindering the studies addressing the RPE-retina interactions. We constructed a retina-mimicking structure from a soft polyacrylamide hydrogel with Matrigel coating and introduced it to RPE cells’ apical side during culturing to model the RPE-retina interface in vitro . RPE cells adhered to the hydrogels during culture, enabling further studies of the biophysical properties of the RPE-hydrogel interface with methods utilizing rheology and traction force microscopy. During phagocytosis, RPE cells generated considerable traction forces that were followed using a hydrogel coated with POS particles. Disruption of RPE’s actin cytoskeleton with Cytochalasin D significantly reduced the force generation. These results support the view of RPE as a mechanically active partner for retina. In addition, our retina-mimicking structure offers a tool for further biophysical modeling of the RPE-retina interface.
-
Homo sapiens (Human)
Borg5 restricts contractility and motility in epithelial MDCK cells.
In Journal of Cell Science on 1 December 2024 by Cohen, D., Fernandez, D., et al.
The Borg (or Cdc42EP) family consists of septin-binding proteins that are known to promote septin-dependent stress fibers and acto-myosin contractility. We show here that epithelial Borg5 (also known as Cdc42EP1) instead limits contractility, cell-cell adhesion tension and motility, as is required for the acquisition of columnar, isotropic cell morphology in mature MDCK monolayers. Borg5 depletion inhibited the development of the lateral F-actin cortex and stimulated microtubule-dependent leading-edge lamellae as well as radial stress fibers and, independently of the basal F-actin phenotype, caused anisotropy of apical surfaces within compacted monolayers. We determined that Borg5 limits colocalization of septin proteins with microtubules, and that like septin 2, Borg5 interacts with the rod-domain of myosin IIA (herein referring to the MYH9 heavy chain). The interaction of myosin IIA with Borg5 was reduced in the presence of septins. Because septins also mediate myosin activation, we propose that Borg5 limits contractility in MDCK cells in part by counteracting septin-associated myosin activity.
© 2024. Published by The Company of Biologists Ltd.
-
Cell Biology
Preprint on BioRxiv : the Preprint Server for Biology on 11 November 2024 by Raab, J. E., Harju, T. B., et al.
ABSTRACT Type 3 secretion systems (T3SSs) enable bacterial virulence by translocating virulence proteins (effectors) into host cells. Shigella flexneri require T3SS to invade and to spread between cells in the colon. In order to spread, S. flexneri forms membrane protrusions that push into the adjacent host cell. These protrusions are resolved into double membrane vacuoles (DMVs) that the bacteria quickly escape. The mechanisms required for escape from the DMV are poorly understood, but the T3SS translocon pore protein IpaC is essential. Here, we show IpaC forms a pore that is competent for translocation of T3SS effectors as bacteria spread between cells. To do so, we used a genetic approach to test mutations of IpaC that disrupt its ability to translocate and to form pores. We show that during spread, IpaC is efficiently inserted into the plasma membrane, the membrane-embedded IpaC forms pore complexes, and the IpaC-dependent pores translocate effectors that are necessary for S. flexneri to escape the DMV. We further show that T3SS activation is regulated through a distinct mechanism at spread compared to at invasion; activation of T3SS secretion does not require pore formation during spread. Thus, we show that a distinct regulation of the T3SS during S. flexneri intercellular spread enables the placement of effectors both around S. flexneri and across membranes of the DMV. Altogether, this study provides new insights into how S. flexneri escapes the DMV. IMPORTANCE The type 3 secretion system (T3SS) is required for virulence in many bacterial pathogens that infect humans. The T3SS forms a pore through which virulence proteins are delivered into host cells to enable bacterial infection. Our work investigates the Shigella translocon pore protein IpaC, which is essential not only for bacteria to invade cells, but also for bacteria to spread between cells. An ability to spread between cells is essential for pathogenesis, thus understanding the mechanisms that enable spread is important for understanding how S. flexneri infection causes illness. We show that IpaC delivers virulence factors across the host membrane for S. flexneri to efficiently spread. This study furthers our understanding of the mechanisms involved in T3SS secretion and of translocon pore function during S. flexneri intercellular spread.
-
ICC-IF
In Cells on 25 September 2024 by Podieh, F., Overboom, M. C., et al.
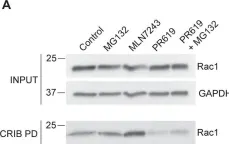
Cell-cell adhesion in endothelial monolayers is tightly controlled and crucial for vascular integrity. Recently, we reported on the importance of fast protein turnover for maintenance of endothelial barrier function. Specifically, continuous ubiquitination and degradation of the Rho GTPase RhoB is crucial to preserve quiescent endothelial integrity. Here, we sought to identify other barrier regulators, which are characterized by a short half-life, using a proteomics approach. Following short-term inhibition of ubiquitination with E1 ligase inhibitor MLN7243 or Cullin E3 ligase inhibitor MLN4924 in primary human endothelial cells, we identified sixty significantly differentially expressed proteins. Intriguingly, our data showed that AAMP and MTSS1 are novel negative regulators of endothelial barrier function and that their turnover is tightly controlled by ubiquitination. Mechanistically, AAMP regulates the stability and activity of RhoA and RhoB, and colocalizes with F-actin and cortactin at membrane ruffles, possibly regulating F-actin dynamics. Taken together, these findings demonstrate the critical role of protein turnover of specific proteins in the regulation of endothelial barrier function, contributing to our options to target dysregulation of vascular permeability.
-
Homo sapiens (Human)
-
Cell Biology
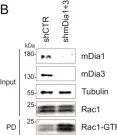
In Elife on 19 March 2024 by Oevel, K., Hohensee, S., et al.
Fig.6.B

-
WB
-
Collected and cropped from Elife by CiteAb, provided under a CC-BY license
Image 1 of 54
In Elife on 19 March 2024 by Oevel, K., Hohensee, S., et al.
Fig.6.A

-
WB
-
Collected and cropped from Elife by CiteAb, provided under a CC-BY license
Image 1 of 54
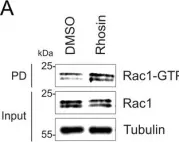
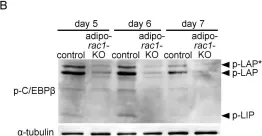
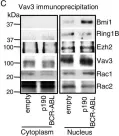
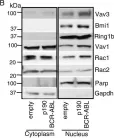
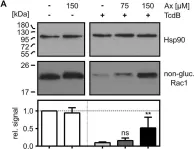
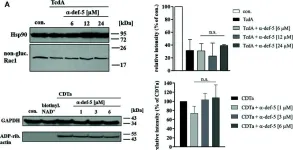
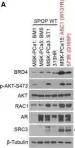
In Biomedicines on 16 January 2024 by Ungefroren, H., Reimann, J., et al.
Fig.4.A

-
WB
-
Homo sapiens (Human)
Collected and cropped from Biomedicines by CiteAb, provided under a CC-BY license
Image 1 of 54
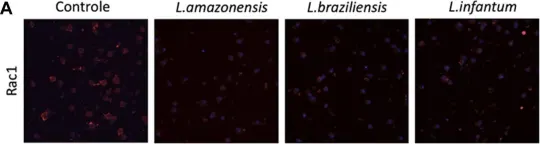
In Front Cell Dev Biol on 14 August 2023 by Luz, Y., Rebouças, A., et al.
Fig.7.A

-
ICC-IF
-
Homo sapiens (Human)
Collected and cropped from Front Cell Dev Biol by CiteAb, provided under a CC-BY license
Image 1 of 54
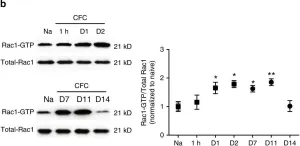
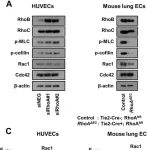
In Int J Mol Sci on 27 February 2023 by Hasegawa, K., Takenaka, N., et al.
Fig.4.B

-
WB
-
Mus musculus (House mouse)
Collected and cropped from Int J Mol Sci by CiteAb, provided under a CC-BY license
Image 1 of 54
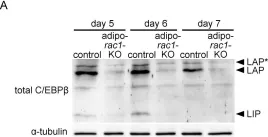
In Int J Mol Sci on 27 February 2023 by Hasegawa, K., Takenaka, N., et al.
Fig.4.A

-
WB
-
Mus musculus (House mouse)
Collected and cropped from Int J Mol Sci by CiteAb, provided under a CC-BY license
Image 1 of 54
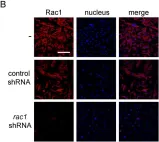
In Int J Mol Sci on 27 February 2023 by Hasegawa, K., Takenaka, N., et al.
Fig.7.B

-
ICC-IF
-
Mus musculus (House mouse)
Collected and cropped from Int J Mol Sci by CiteAb, provided under a CC-BY license
Image 1 of 54
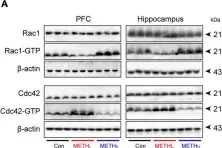
In Front Cell Neurosci on 22 November 2022 by Ding, J., Huang, J., et al.
Fig.6.A

-
WB
-
Collected and cropped from Front Cell Neurosci by CiteAb, provided under a CC-BY license
Image 1 of 54
In Nat Commun on 1 June 2022 by Nayak, R. C., Chang, K. H., et al.
Fig.3.C

-
WB
-
Mus musculus (House mouse)
Collected and cropped from Nat Commun by CiteAb, provided under a CC-BY license
Image 1 of 54
In Nat Commun on 1 June 2022 by Nayak, R. C., Chang, K. H., et al.
Fig.3.B

-
WB
-
Mus musculus (House mouse)
Collected and cropped from Nat Commun by CiteAb, provided under a CC-BY license
Image 1 of 54
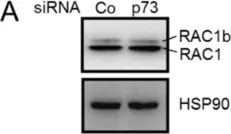
In Cancers (Basel) on 8 May 2022 by Buchou, C., Laud-Duval, K., et al.
Fig.5.A

-
WB
-
Collected and cropped from Cancers (Basel) by CiteAb, provided under a CC-BY license
Image 1 of 54
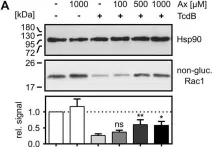
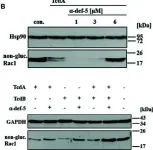
In Front Pharmacol on 22 January 2022 by Heber, S., Barthold, L., et al.
Fig.4.A

-
WB
-
Collected and cropped from Front Pharmacol by CiteAb, provided under a CC-BY license
Image 1 of 54
In Front Pharmacol on 22 January 2022 by Heber, S., Barthold, L., et al.
Fig.2.A

-
WB
-
Collected and cropped from Front Pharmacol by CiteAb, provided under a CC-BY license
Image 1 of 54
In Cancers (Basel) on 11 November 2021 by Nyabuto, G. O., Wilson, J. P., et al.
Fig.6.A

-
WB
-
Collected and cropped from Cancers (Basel) by CiteAb, provided under a CC-BY license
Image 1 of 54
In PLoS One on 13 July 2021 by Majolée, J., Podieh, F., et al.
Fig.1.A

-
WB
-
Collected and cropped from PLoS One by CiteAb, provided under a CC-BY license
Image 1 of 54
In Front Pharmacol on 10 September 2020 by Korbmacher, M., Fischer, S., et al.
Fig.1.B

-
WB
-
Collected and cropped from Front Pharmacol by CiteAb, provided under a CC-BY license
Image 1 of 54
In Front Pharmacol on 10 September 2020 by Korbmacher, M., Fischer, S., et al.
Fig.4.A

-
WB
-
Collected and cropped from Front Pharmacol by CiteAb, provided under a CC-BY license
Image 1 of 54
In Nat Commun on 22 November 2019 by Lv, L., Liu, Y., et al.
Fig.1.B

-
WB
-
Collected and cropped from Nat Commun by CiteAb, provided under a CC-BY license
Image 1 of 54
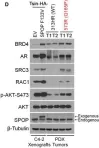
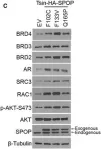
In EMBO Mol Med on 7 November 2019 by Yan, Y., Ma, J., et al.
Fig.2.D

-
WB
-
Collected and cropped from EMBO Mol Med by CiteAb, provided under a CC-BY license
Image 1 of 54
In EMBO Mol Med on 7 November 2019 by Yan, Y., Ma, J., et al.
Fig.2.C

-
WB
-
Collected and cropped from EMBO Mol Med by CiteAb, provided under a CC-BY license
Image 1 of 54
In EMBO Mol Med on 7 November 2019 by Yan, Y., Ma, J., et al.
Fig.6.A

-
WB
-
Collected and cropped from EMBO Mol Med by CiteAb, provided under a CC-BY license
Image 1 of 54
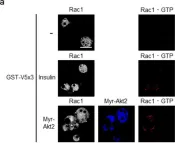
In Int J Mol Sci on 31 October 2019 by Takenaka, N., Nakao, M., et al.
Fig.5.A

-
ICC-IF
-
Collected and cropped from Int J Mol Sci by CiteAb, provided under a CC-BY license
Image 1 of 54
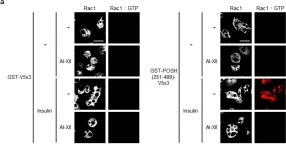
In Int J Mol Sci on 31 October 2019 by Takenaka, N., Nakao, M., et al.
Fig.6.A

-
ICC-IF
-
Collected and cropped from Int J Mol Sci by CiteAb, provided under a CC-BY license
Image 1 of 54
In Sci Rep on 12 August 2019 by Zahra, F. T., Sajib, M. S., et al.
Fig.7.A

-
WB
-
Collected and cropped from Sci Rep by CiteAb, provided under a CC-BY license
Image 1 of 54
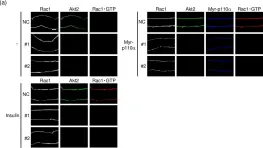
In PLoS One on 9 February 2019 by Takenaka, N., Araki, N., et al.
Fig.2.A

-
ICC-IF
-
Collected and cropped from PLoS One by CiteAb, provided under a CC-BY license
Image 1 of 54