
Dynamic regulation of metabolic activities in astrocytes is critical to meeting the demands of other brain cells. During neuronal stress, lipids are transferred from neurons to astrocytes, where they are stored in lipid droplets (LDs). However, it is not clear whether and how neuron-derived lipids trigger metabolic adaptation in astrocytes. Here, we uncover an endolysosomal function that mediates neuron-astrocyte transcellular lipid signaling. We identify Tweety homolog 1 (TTYH1) as an astrocyte-enriched endolysosomal protein that facilitates autophagic flux and LD degradation. Astrocyte-specific deletion of mouse Ttyh1 and loss of its Drosophila ortholog lead to brain accumulation of neutral lipids. Computational and experimental evidence suggests that TTYH1 mediates endolysosomal clearance of ceramide 1-phosphate (C1P), a sphingolipid that dampens autophagic flux and LD breakdown in mouse and human astrocytes. Furthermore, neuronal C1P secretion induced by inflammatory cytokine interleukin-1β causes TTYH1-dependent autophagic flux and LD adaptations in astrocytes. These findings reveal a neuron-initiated signaling paradigm that culminates in the regulation of catabolic activities in astrocytes.
© 2025. The Author(s).
Product Citations: 138
In Nature Communications on 31 May 2025 by Bhupana, J. N., Pabon, A., et al.
-
Cell Biology
-
Neuroscience
The V-ATPase/ATG16L1 axis drives membrane remodeling during epithelial morphogenesis
Preprint on BioRxiv : the Preprint Server for Biology on 28 April 2025 by Baonza, G., Alfonso-Pérez, T., et al.
SUMMARY Epithelial tubulogenesis shapes internal organs by transforming flat epithelial sheets or unpolarized cords into hollow tubes with central lumens. A key example is the formation of the posterior neural tube during secondary neurulation, which requires precise morphogenetic events for de novo lumen formation. Although several studies have highlighted the role of autophagy in specific morphogenetic events, its involvement in epithelial organ development remains unclear. Autophagy operates via canonical and noncanonical pathways. Canonical autophagy is catabolic, requiring double-membrane autophagosomes and the full ATG protein set. Noncanonical autophagy, including the V-ATPase/ATG16L1-dependent Conjugation of ATG8 in Single Membranes (CASM), has both degradative and non-degradative roles and regulates different membrane trafficking processes. Using human neural tube organoids, spheroids, and tube micropatterns deficient in CASM or canonical autophagy, we show that CASM plays a pivotal role in epithelial tube morphogenesis. Specifically, the V-ATPase/ATG16L1 axis is essential for de novo lumen formation by regulating membrane junction remodeling and Rab11-dependent recycling pathways. These findings reveal distinct contributions of autophagy pathways in epithelial development, with potential implications for diseases linked to autophagy dysfunction.
A competition network connects Rab5 and Rab11 GTPases at the surface of endocytic structures.
In IScience on 18 April 2025 by Ferro, E., Tealdi, S., et al.
Specificity in membrane trafficking relies on the interaction between Rab small GTPase proteins and their molecular effectors. However, the evidence that different Rab proteins can bind to common effectors challenges this view. Here, we show that molecular competition between distinct Rab GTPases for a shared protein can link diverse membrane trafficking pathways. Theoretical analysis and experimental data support a role for Zfyve26 as a part of a competitive network that modulates changes in Rab5-Rab11 abundance, activation status, and correlation at the surface of single endocytic structures. By leveraging on the Loop index, a novel metric that couples the GTP-bound fraction and the total amount of Rab GTPase, we infer the saturation of Zfyve26 molecules at the endocytic surface from time-lapse imaging data. Our findings establish that transduction in the endocytic system is governed by stoichiometric constraints determining the trade-off between different trafficking pathways at the surface of a membrane-bound organelle.
© 2025 The Author(s).
In Nature Communications on 4 February 2025 by Kondo, N., Mimori-Kiyosue, Y., et al.
The leukocyte integrin LFA1 is indispensable for immune responses, orchestrating lymphocyte trafficking and adhesion. While LFA1 activation induces LFA1 clustering at the cell contact surface via outside-in signaling, the regulatory mechanisms remain unclear. Here, we uncovered a previously hidden function of the autophagosome component LC3 beyond its role in autophagy by bridging two seemingly unrelated pathways: LFA1 transport and autophagosome transport. LFA1 clusters co-trafficked with LC3, facilitating LFA1 accumulation at the contact surface. LC3b knockout decreased lymphocyte adhesiveness. LFA1 activation did not induce autophagy, whereas it increased mTOR and AMPK activity. LFA1-dependent AMPK activation enhances LFA1 and LC3 clustering and adhesion. Inhibiting Mst1 kinase-mediated LC3 phosphorylation promoted LC3-mediated LFA1 recruitment to the contact surface through direct interaction with RAPL, uncovering an unprecedented integrin recruitment route. These findings uncover a function of LC3 and expand our understanding of lymphocyte regulation via LFA1.
© 2025. The Author(s).
-
Cell Biology
In Journal of Cell Science on 15 January 2025 by Fresquez, T., Tam, B. M., et al.
The Rab11-Rabin8-Rab8 ciliogenesis complex regulates the expansion of cilia-derived light-sensing organelles, the rod outer segments, via post-Golgi rhodopsin transport carriers (RTCs). Rabin8 (also known as RAB3IP), an effector of Rab11 proteins and a nucleotide exchange factor (GEF) for Rab8 proteins, is phosphorylated at S272 by NDR2 kinase (also known as STK38L), the canine early retinal degeneration (erd) gene product linked to the human ciliopathy Leber congenital amaurosis (LCA). Here, we define the step at which NDR2 phosphorylates Rabin8 and regulates Rab11-to-Rab8 succession in Xenopus laevis transgenic rod photoreceptors expressing human GFP-Rabin8 and its mutants. GFP-Rabin8 accumulated with endogenous Rabin8 at the Golgi-apposed exit sites (GESs), also known as the trans-Golgi network (TGN). Rabin8 mutants deficient in Rab11 binding prevented membrane association of GFP-Rabin8. GFP-Rabin8 and NDR2 kinase both interacted with the RTC-associated R-SNARE VAMP7 at the trans-Golgi and the GESs. Here, GFP-Rabin8 and the phosphomimetic GFP-Rabin8-S272E integrated into RTCs, which were subsequently functionalized by Rabin8 Rab8 GEF activity. Non-phosphorylatable GFP-Rabin8-S272A caused significant GES enlargement and deformation, possibly leading to unconventional membrane advancement toward the cilium, bypassing RTCs. Rabin8 phosphorylation loss due to an NDR2 gene disruption thereby likely causes dysfunctional rhodopsin Golgi-to-cilia trafficking underlying retinal degeneration and early-onset blindness.
© 2025. Published by The Company of Biologists.
-
Cell Biology
-
Veterinary Research
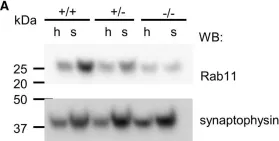
In Cell Mol Life Sci on 17 October 2022 by Keable, R., Hu, S., et al.
Fig.7.A
-
WB
-
Collected and cropped from Cell Mol Life Sci by CiteAb, provided under a CC-BY license
Image 1 of 8
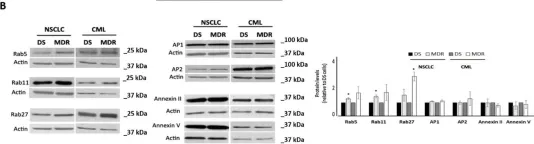
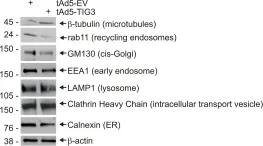
In Cells on 26 October 2021 by Sousa, D., Lima, R. T., et al.
Fig.1.B

-
WB
-
Collected and cropped from Cells by CiteAb, provided under a CC-BY license
Image 1 of 8
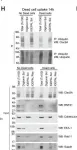
In Elife on 2 December 2020 by Tullett, K. M., Tan, P. S., et al.
Fig.5.H

-
WB
-
Collected and cropped from Elife by CiteAb, provided under a CC-BY license
Image 1 of 8
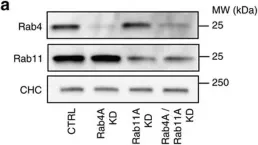
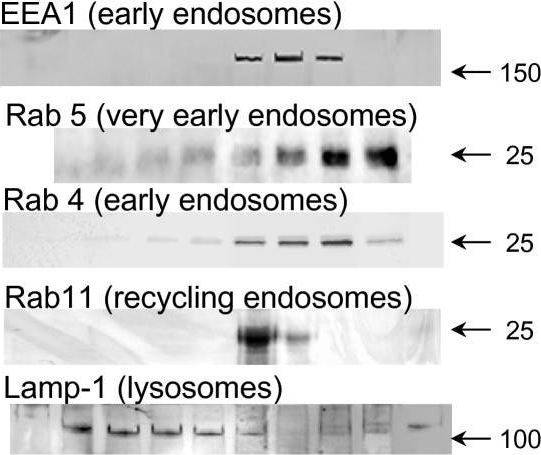
In Nat Commun on 5 December 2016 by Chmiest, D., Sharma, N., et al.
Fig.2.A

-
WB
-
Collected and cropped from Nat Commun by CiteAb, provided under a CC-BY license
Image 1 of 8
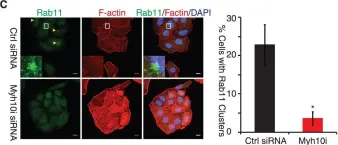
In PLoS One on 11 December 2014 by Rao, Y., Hao, R., et al.
Fig.3.C

-
ICC-IF
-
Collected and cropped from PLoS One by CiteAb, provided under a CC-BY license
Image 1 of 8
In PLoS One on 23 August 2011 by Scharadin, T. M., Jiang, H., et al.
Fig.7.A

-
WB
-
Homo sapiens (Human)
Collected and cropped from PLoS One by CiteAb, provided under a CC-BY license
Image 1 of 8
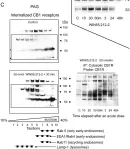
In Mol Pain on 10 March 2009 by Garzón, J., de la Torre-Madrid, E., et al.
Fig.3.C

-
WB
-
Collected and cropped from Mol Pain by CiteAb, provided under a CC-BY license
Image 1 of 8
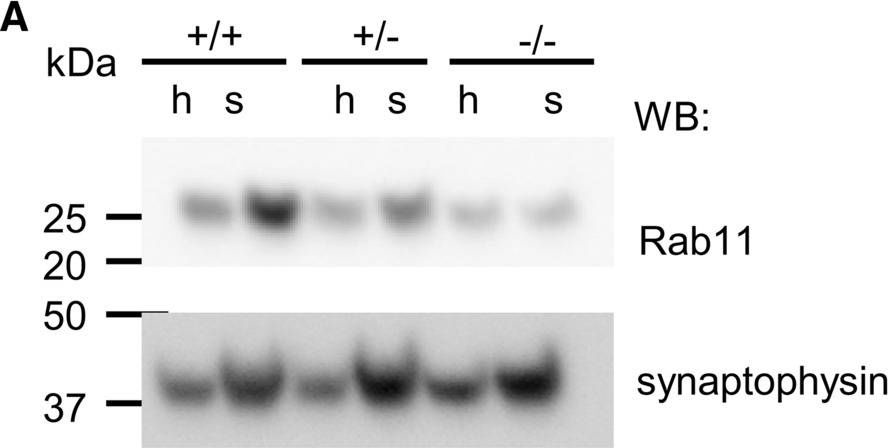
In Mol Pain on 17 July 2007 by Rodríguez-Muñoz, M., de la Torre-Madrid, E., et al.
Fig.4.A
-
WB
-
Mus musculus (House mouse)
Collected and cropped from Mol Pain by CiteAb, provided under a CC-BY license
Image 1 of 8