Huntington's disease (HD) is caused by the expansion of the polyglutamine stretch in huntingtin protein (HTT) resulting in hallmark aggresomes/inclusion bodies (IBs) composed of mutant huntingtin protein (mHTT) and its fragments. Stimulating autophagy to enhance mHTT clearance is considered a potential therapeutic strategy for HD. Our recent evaluation of the autophagic-lysosomal pathway (ALP) in human HD brain reveals upregulated lysosomal biogenesis and relatively normal autophagy flux in early Vonsattel grade brains, but impaired autolysosome clearance in late grade brains, suggesting that autophagy stimulation could have therapeutic benefits as an early clinical intervention. Here, we tested this hypothesis by crossing the Q175 HD knock-in model with our autophagy reporter mouse TRGL (Thy-1-RFP-GFP-LC3) to investigate in vivo neuronal ALP dynamics. In the Q175 and/or TRGL/Q175 mice, mHTT was detected in autophagic vacuoles and also exhibited a high level of colocalization with autophagy receptors p62/SQSTM1 and ubiquitin in the IBs. Compared to the robust lysosomal pathology in late-stage human HD striatum, ALP alterations in Q175 models are also late-onset but milder, that included a lowered phospho-p70S6K level, lysosome depletion, and autolysosome elevation including more poorly acidified autolysosomes and larger-sized lipofuscin granules, reflecting impaired autophagic flux. Administration of a mTOR inhibitor to 6-mo-old TRGL/Q175 normalized lysosome number, ameliorated aggresome pathology while reducing mHTT-, p62-, and ubiquitin-immunoreactivities, suggesting the beneficial potential of autophagy modulation at early stages of disease progression.
© 2025, Stavrides et al.
Product Citations: 301
In eLife on 20 May 2025 by Stavrides, P., Goulbourne, C. N., et al.
-
Cell Biology
Preprint on BioRxiv : the Preprint Server for Biology on 7 March 2025 by Ferret, L., Pol, J. G., et al.
Lysosomes are known to contribute to the development of drug resistance through a variety of mechanisms that include the sequestration of drugs within their compartments and the activation of adaptive stress pathways. Although targeting POL I (RNA polymerase I) exhibits anticancer effects, little attention has been paid to the contribution of lysosomes to the efficacy and resistance of RNA POL I inhibitors. In this study, we investigated this aspect in the context of two potent POL I inhibitors, CX-3543 (Quarfloxin) and CX-5461 (Pidnarulex). Unexpectedly, CX-3543 was discovered to be sequestered in the lysosomal compartment. This resulted in the permeabilization of lysosomal membranes (LMP) and the subsequent activation of cellular stress adaptation pathways, including the transcription factor (TFEB) and autophagy. Disruption of TFEB or autophagy increased cell sensitivity to CX-3543, highlighting the cytoprotective role of these processes against cell death induced by this compound. Moreover, targeting lysosomal membranes using chloroquine derivatives or blue light excitation induced substantial LMP, resulting in the liberation of CX-3543 from lysosomes. This effect amplified both the inhibition of DNA-to-RNA transcription and cell death induced by CX-3543. Similar effects were observed when chloroquine derivatives were combined with CX-5461. Furthermore, combining CX-3543 with the chloroquine derivative DC661 reduced the growth of fibrosarcoma established in immunocompetent mice more efficiently than either agent alone. Altogether, our results uncover an unanticipated lysosome-related mechanism that contributes to the resistance of cancer cells to POL I transcription inhibitors, as well as a strategy to combat this resistance.
-
Biochemistry and Molecular biology
-
Cell Biology
-
Genetics
Preprint on MedRxiv : the Preprint Server for Health Sciences on 25 February 2025 by Selmanovic, E., Pruyser, A., et al.
Chronic traumatic encephalopathy-neuropathologic change (CTE-NC) has been primarily studied in contact sport athletes with repetitive head impacts (RHI). An association with isolated traumatic brain injury (TBI) is less clear. We systematically reviewed the autopsied cohort of Late Effects of TBI (LETBI), characterized primarily by isolated TBI but also including RHI, for features of CTE-NC. A consecutive series of 44 brains underwent comprehensive neuropathologic evaluation, exceeding recommended CTE consensus protocols. Of the 44, 6 (13.6%) (age range, 3rd-7th decades; median, 6th decade) had CTE-NC, forming the basis for this exploratory analysis. Ex vivo neuroimaging (in 4 of 6) highlighted traumatic and white matter microvascular lesions, facilitating histological sampling of subtle neuropathologies that might otherwise have been missed by conventional sectioning. Macroscopically, 5 had cortical (contusional) and white matter (torsional) volume loss, with septal lesions and hydrocephalus ex vacuo (i.e., structural lesions of moderate-severe TBI). Microscopically, tau-immunopositive neuronal and astrocytic pathology in a perivascular arrangement within sulcal depths met current pathognomonic criteria for CTE-NC in 5 (3 low and 2 high burden); 1 had more limited findings considered suspicious for CTE-NC. Five of 6 cases with any CTE-NC reported substantial exposure to RHI, through contact sport ranging over at least 16 years. One case had no known exposure to RHI: this case (death: 6th decade) had 2 isolated severe TBIs (sustained 30y and 3y prior to death). Of note, one case with high CTE also had Alzheimer Disease Neuropathologic Change (high stage), Lewy Body Disease (limbic), and TDP43 accumulation (polyproteinopathy). Aging-related tau astrogliopathy, mostly subpial, was seen in 4 cases. Glial tau was also noted around old cavitary contusions in 2. These findings converge with prior studies demonstrating that CTE is largely associated with RHI and is infrequent among individuals with isolated TBI.
Hippocampal mitophagy alterations in MAPT-associated frontotemporal dementia with parkinsonism.
In Acta Neuropathologica Communications on 24 February 2025 by Richardson, T., Hou, X., et al.
The enzyme pair PINK1 and PRKN together orchestrates a cytoprotective mitophagy pathway that selectively tags damaged mitochondria with phospho-serine 65 ubiquitin (pS65-Ub) and directs them for autophagic-lysosomal degradation (mitophagy). We previously demonstrated a significant accumulation of pS65-Ub signals in autopsy brains of sporadic Lewy body disease and Alzheimer's disease cases, which strongly correlated with early tau pathology. In this study, we extended our analysis to a series of pathologically confirmed cases of frontotemporal dementia with parkinsonism linked to chromosome 17 (FTDP-17) harboring different pathogenic mutations in MAPT, the gene encoding tau. We assessed the morphology, levels, and distribution of the mitophagy tag pS65-Ub in several affected brain regions and hippocampal subregions of these cases. While tau pathological burden was similarly increased across all FTDP-17 cases, pS65-Ub immunopositive signals were strongly accumulated in P301L cases and only weakly present in N279K cases. In the hippocampus of both mutation groups, the density of pS65-Ub positive cells was overall the greatest in the dentate gyrus followed by the subiculum, CA1, and CA2/3, with the CA4 showing only minimal presence. Notably, positive cells in the subiculum carried greater numbers and particularly vacuolar pS65-Ub structures, while cells in the dentate gyrus mostly contained fewer and rather granular pS65-Ub inclusions. Single cell analyses revealed differential co-localization of pS65-Ub with mitochondria, autophagosomes, and lysosomes in these two regions. Together, our study demonstrates distinct mitophagy alteration in different FTDP-17 MAPT cases and hint at selective organelle failure in the hippocampal subregions that was associated with the P301L mutation.
© 2025. The Author(s).
-
Neuroscience
KEAP1 retention in phase-separated p62 bodies drives liver damage in autophagy-deficient conditions
Preprint on BioRxiv : the Preprint Server for Biology on 21 February 2025 by Komatsu, M., Takada, S., et al.
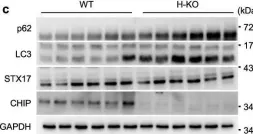
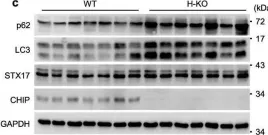
Phase-separated p62 bodies activate NRF2, a key transcription factor for antioxidant response, by sequestering KEAP1, which targets NRF2 for degradation. Although p62 bodies containing KEAP1 are degraded by autophagy, they accumulate in various liver disorders. Their precise disease role remains unclear. We show that excessive KEAP1 retention in p62 bodies and NRF2 activation are major causes of liver damage when autophagy is impaired. In mice with weakened or blocked p62-KEAP1 interactions, KEAP1 retention and NRF2 activation under autophagy-deficient conditions were suppressed. Transcriptome and proteome analyses revealed that NRF2 targets upregulated by autophagy suppression normalized in p62 mutants unable to bind KEAP1. Autophagy deficiency caused organelle accumulation, especially of the ER, regardless of p62 mutation. Liver damage and hepatomegaly from autophagy suppression markedly improved in p62 mutants, particularly those with blocked KEAP1 binding. These findings highlight excessive KEAP1 retention in p62 bodies and defective organelle turnover as key drivers of liver pathology, underscoring the significance of phase separation in vivo.
-
Cell Biology
In Nat Commun on 2 October 2024 by Rho, H., Kim, S., et al.
Fig.5.C

-
WB
-
Collected and cropped from Nat Commun by CiteAb, provided under a CC-BY license
Image 1 of 104
In Nat Commun on 2 October 2024 by Rho, H., Kim, S., et al.
Fig.3.C

-
WB
-
Collected and cropped from Nat Commun by CiteAb, provided under a CC-BY license
Image 1 of 104
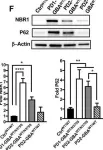
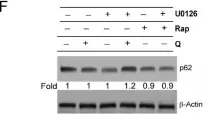
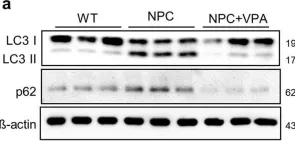
In Front Neurosci on 19 June 2023 by Mubariz, F., Saadin, A., et al.
Fig.6.F

-
WB
-
Collected and cropped from Front Neurosci by CiteAb, provided under a CC-BY license
Image 1 of 104
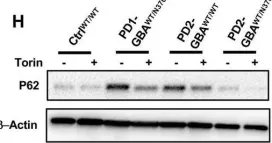
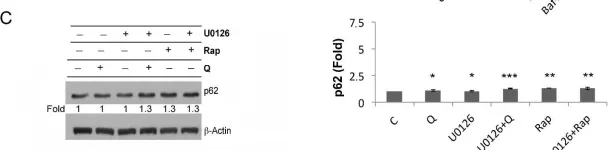
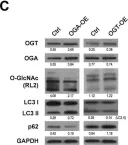
In Front Neurosci on 19 June 2023 by Mubariz, F., Saadin, A., et al.
Fig.6.H

-
WB
-
Collected and cropped from Front Neurosci by CiteAb, provided under a CC-BY license
Image 1 of 104
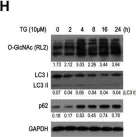
In Biology (Basel) on 2 May 2023 by Germano, C. A., Clemente, G., et al.
Fig.5.F

-
WB
-
Collected and cropped from Biology (Basel) by CiteAb, provided under a CC-BY license
Image 1 of 104
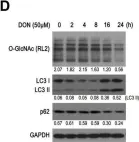
In Biology (Basel) on 2 May 2023 by Germano, C. A., Clemente, G., et al.
Fig.5.C

-
WB
-
Collected and cropped from Biology (Basel) by CiteAb, provided under a CC-BY license
Image 1 of 104
In Theranostics on 2 August 2022 by Li, Y., Lei, Z., et al.
Fig.9.A

-
WB
-
Mus musculus (House mouse)
Collected and cropped from Theranostics by CiteAb, provided under a CC-BY license
Image 1 of 104
In Theranostics on 2 August 2022 by Li, Y., Lei, Z., et al.
Fig.6.A

-
WB
-
Mus musculus (House mouse)
Collected and cropped from Theranostics by CiteAb, provided under a CC-BY license
Image 1 of 104
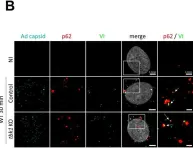
In PLoS Pathog on 1 July 2022 by Pied, N., Daussy, C. F., et al.
Fig.7.B

-
ICC-IF
-
Homo sapiens (Human)
Collected and cropped from PLoS Pathog by CiteAb, provided under a CC-BY license
Image 1 of 104
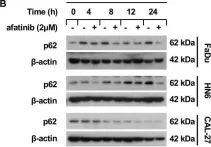
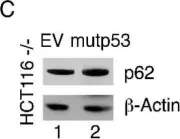
In Int J Mol Sci on 17 June 2022 by Gonnella, R., Zarrella, R., et al.
Fig.1.D

-
WB
-
Collected and cropped from Int J Mol Sci by CiteAb, provided under a CC-BY license
Image 1 of 104
In Cells on 30 November 2021 by Merhi, F., Alvarez-Valadez, K., et al.
Fig.3.C

-
WB
-
Homo sapiens (Human)
Collected and cropped from Cells by CiteAb, provided under a CC-BY license
Image 1 of 104
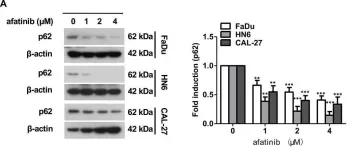
In Cell Death Dis on 22 July 2021 by Liu, X., Suo, H., et al.
Fig.2.B

-
WB
-
Collected and cropped from Cell Death Dis by CiteAb, provided under a CC-BY license
Image 1 of 104
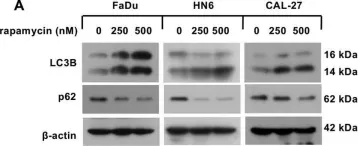
In Cell Death Dis on 22 July 2021 by Liu, X., Suo, H., et al.
Fig.2.A

-
WB
-
Collected and cropped from Cell Death Dis by CiteAb, provided under a CC-BY license
Image 1 of 104
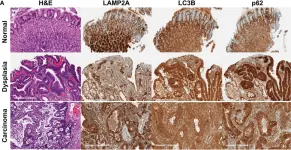
In Cell Death Dis on 22 July 2021 by Liu, X., Suo, H., et al.
Fig.3.A

-
WB
-
Collected and cropped from Cell Death Dis by CiteAb, provided under a CC-BY license
Image 1 of 104
In Front Oncol on 17 April 2021 by Yoon, J. Y., Brezden-Masley, C., et al.
Fig.1.A

-
IHC
-
Collected and cropped from Front Oncol by CiteAb, provided under a CC-BY license
Image 1 of 104
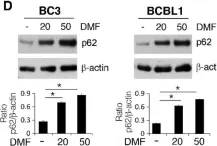
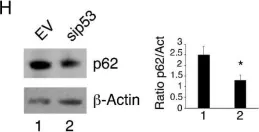
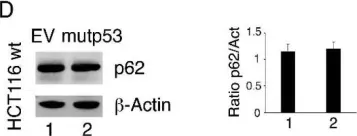
In Biomolecules on 24 February 2021 by Romeo, M. A., Gilardini Montani, M. S., et al.
Fig.1.H

-
WB
-
Collected and cropped from Biomolecules by CiteAb, provided under a CC-BY license
Image 1 of 104
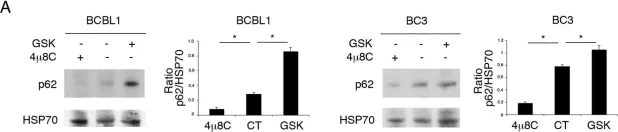
In Biomolecules on 24 February 2021 by Romeo, M. A., Gilardini Montani, M. S., et al.
Fig.5.C

-
WB
-
Collected and cropped from Biomolecules by CiteAb, provided under a CC-BY license
Image 1 of 104
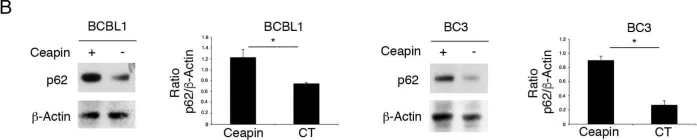
In Biomolecules on 24 February 2021 by Romeo, M. A., Gilardini Montani, M. S., et al.
Fig.5.D

-
WB
-
Collected and cropped from Biomolecules by CiteAb, provided under a CC-BY license
Image 1 of 104
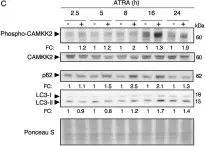
In Biomedicines on 27 January 2021 by Gonnella, R., Gilardini Montani, M. S., et al.
Fig.3.B

-
WB
-
Collected and cropped from Biomedicines by CiteAb, provided under a CC-BY license
Image 1 of 104
In Biomedicines on 27 January 2021 by Gonnella, R., Gilardini Montani, M. S., et al.
Fig.3.A

-
WB
-
Collected and cropped from Biomedicines by CiteAb, provided under a CC-BY license
Image 1 of 104
In Cell Death Dis on 12 December 2020 by Lee, S. E., Shin, N., et al.
Fig.7.A

-
WB
-
Collected and cropped from Cell Death Dis by CiteAb, provided under a CC-BY license
Image 1 of 104
In Cell Mol Biol Lett on 17 March 2020 by Jin, L., Yuan, F., et al.
Fig.1.H

-
WB
-
Homo sapiens (Human)
Collected and cropped from Cell Mol Biol Lett by CiteAb, provided under a CC-BY license
Image 1 of 104
In Cell Mol Biol Lett on 17 March 2020 by Jin, L., Yuan, F., et al.
Fig.1.D

-
WB
-
Homo sapiens (Human)
Collected and cropped from Cell Mol Biol Lett by CiteAb, provided under a CC-BY license
Image 1 of 104
In Cell Mol Biol Lett on 17 March 2020 by Jin, L., Yuan, F., et al.
Fig.2.C

-
WB
-
Homo sapiens (Human)
Collected and cropped from Cell Mol Biol Lett by CiteAb, provided under a CC-BY license
Image 1 of 104
In Cell Mol Biol Lett on 17 March 2020 by Jin, L., Yuan, F., et al.
Fig.5.B

-
WB
-
Homo sapiens (Human)
Collected and cropped from Cell Mol Biol Lett by CiteAb, provided under a CC-BY license
Image 1 of 104