BackgroundPrP systemic amyloidosis is increasingly recognized as a novel inherited prion disease (IPD) syndrome caused by PRNP C-terminal truncating mutations. As well as systemic manifestations they cause gradually progressive cognitive impairment with neurofibrillary tangle pathology which can be mistaken for Alzheimer's disease (AD).ObjectiveWe describe the clinical, biomarker and neuropathological features of a novel frameshift mutation of PRNP resulting in protein truncation at codon 157.MethodsThe clinical phenotype and biomarker findings, including plasma biomarkers measured using Single Molecule Array (SiMOA) technology are reported for affected living individuals, with neuropathological examination available for the index case.ResultsThe Y157X PRNP mutation has resulted in a phenotype of gradually progressive cognitive decline, peripheral sensory and autonomic polyneuropathy, and gastrointestinal symptoms, with one case presenting with recurrent episodes of nausea, vomiting and electrolyte derangement requiring intensive care unit admission. Plasma biomarkers revealed an AD-like pattern with raised neurofilament light chain (NfL), glial fibrillary acidic protein (GFAP) and phospho-tau 181 (P-tau 181) in affected individuals. On neuropathological examination there was PrP-cerebral amyloid angiopathy (CAA) and neurofibrillary tau pathology.ConclusionsWe present the clinical, biomarker and pathological findings on investigation of this family and provide further evidence for the association of truncation mutations with PrP systemic amyloidosis.
Product Citations: 223
In Journal of Alzheimer's Disease : JAD on 1 August 2025 by Holm-Mercer, L., Mok, T. H., et al.
-
Neuroscience
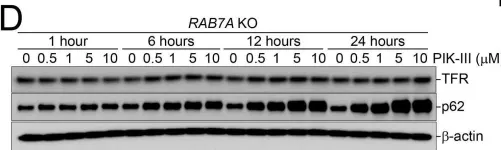
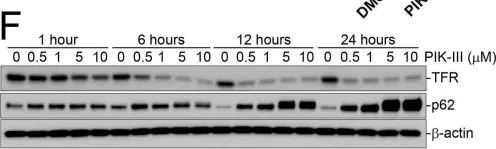
In Autophagy Rep on 21 May 2025 by Reyne, E., Arrindell, J., et al.
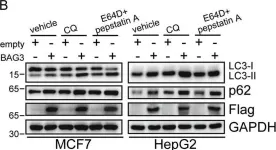
Tropheryma whipplei, the agent of Whipple's disease, is an intracellular pathogen that replicates in macrophages. The phagocytic and cellular processes leading to the formation of T. whipplei replicative vacuole remain poorly understood. Macrophage microbicidal activity is largely related to macro/autophagy which is also essential for cell homeostasis. Here, we show that T. whipplei uptake by macrophages involved LC3-associated phagocytosis (LAP). Bacteria then escaped into the cytosol from where they were recaptured by xenophagy. We also demonstrate that T. whipplei blocked the autophagic flux to build its replicative compartment. Inhibition of LAP resulted in the decrease of interleukin (IL)-10 secretion and the restoration of the autophagy flux, suggesting that modulation of autophagy during infection alters immune response and promote persistence. Our results provide new insight in the intracellular fate of the bacteria during macrophage infection and suggest the possible involvement of previously unknown virulence factors in T. whipplei infection.
© 2025 The Author(s). Published by Informa UK Limited, trading as Taylor & Francis Group.
-
Immunology and Microbiology
Low extracellular pH protects cancer cells from ammonia toxicity.
In Cell Death Discovery on 3 April 2025 by Dravecka, M., Mikkola, I., et al.
Ammonia is a natural waste product of cellular metabolism which, through its lysosomotropic ability, can have detrimental effects on various cellular functions. Increased levels of ammonia were recently detected in the interstitial fluid of various tumours, substantiating that high ammonia concentrations are a pathophysiological condition in the tumour microenvironment, alongside hypoxia and acidosis. Since little is known about how cancer cells respond to elevated levels of ammonia in the tumour microenvironment, we investigated how a panel of cancer cell lines derived from solid tumours behaved when exposed to increasing concentrations of ammonia. We found that ammonia represses cell growth, induces genome instability, and inhibits lysosome-mediated proteolysis in a dose-dependent manner. Unexpectedly, we also found that small fluctuations in the pH of the extracellular environment, had a significant impact on the cytotoxic effects of ammonia. In summary, our data show that the balance of pH and ammonia within the interstitial fluids of cancerous tumours significantly impacts the behaviour and fate of cells residing in the tumour microenvironment.
© 2025. The Author(s).
-
Cancer Research
In Journal of Neurology on 29 March 2025 by Coysh, T., Jaunmuktane, Z., et al.
Inherited prion diseases (IPDs) are phenotypically diverse neurodegenerative conditions caused by mutations in the prion protein gene (PRNP). We describe IPD due to a novel PRNP E146G mutation in a 50-year-old man presenting with slowly progressive dysarthria, prominent myoclonus especially in the lower limbs, and less prominent gait ataxia, pyramidal and extrapyramidal signs. Cognitive impairment was not overt at disease onset. MRI revealed cerebellar atrophy and white matter hyperintensities. His 46-year-old sister carries the mutation and has subtle gait ataxia and dysarthria. Both patients exhibit a distinctive fluid biomarker profile: in CSF S100B is > twofold upper limit of normal, total tau is moderately elevated, and neurofilament light chain, 14-3-3 and RT-QuIC are negative; in plasma there is marked elevation of GFAP but repeatedly normal neurofilament light chain. The proband's father died aged 55 following an 8-year dementing illness with similar presentation. Post-mortem revealed cerebellar cortical atrophy and profuse large PrP amyloid plaques across cerebral and cerebellar grey matter. Immunoblotting identified low molecular weight protease-resistant PrP fragments. E146G mutation IPD broadly fits into the historical Gerstmann-Sträussler-Scheinker disease spectrum but, based on deep clinical phenotyping of this initial pedigree, we highlight some distinctive features, which may aid in identification of this disease.
© 2025. The Author(s).
-
WB
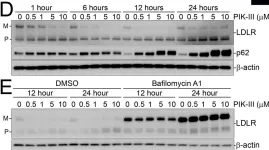
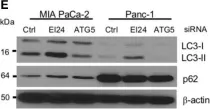
In International Journal of Molecular Sciences on 10 January 2025 by Romano, R., Cordella, P., et al.
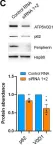
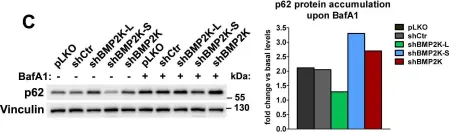
Peripherin belongs to heterogeneous class III of intermediate filaments, and it is the only intermediate filament protein selectively expressed in the neurons of the peripheral nervous system. It has been previously discovered that peripherin interacts with proteins important for the endo-lysosomal system and for the transport to late endosomes and lysosomes, such as RAB7A and AP-3, although little is known about its role in the endocytic pathway. Here, we show that peripherin silencing affects lysosomal abundance but also positioning, causing the redistribution of lysosomes from the perinuclear area to the cell periphery. Moreover, peripherin silencing affects lysosomal activity, inhibiting EGFR degradation and the degradation of a fluorogenic substrate for proteases. Furthermore, we demonstrate that peripherin silencing affects lysosomal biogenesis by reducing the TFEB and TFE3 contents. Finally, in peripherin-depleted cells, the autophagic flux is strongly inhibited. Therefore, these data indicate that peripherin has an important role in regulating lysosomal biogenesis, and positioning and functions of lysosomes, affecting both the endocytic and autophagic pathways. Considering that peripherin is the most abundant intermediate filament protein of peripheral neurons, its dysregulation, affecting its functions, could be involved in the onset of several neurodegenerative diseases of the peripheral nervous system characterized by alterations in the endocytic and/or autophagic pathways.
-
WB
-
Cell Biology
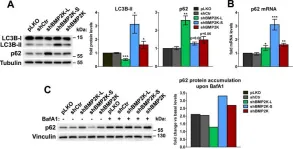
In Int J Mol Sci on 10 January 2025 by Romano, R., Cordella, P., et al.
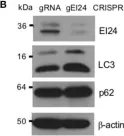
Fig.2.C

-
WB
-
Collected and cropped from Int J Mol Sci by CiteAb, provided under a CC-BY license
Image 1 of 67
In Int J Mol Sci on 13 June 2024 by Inukai, R., Mori, K., et al.
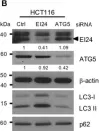
Fig.3.B

-
WB
-
Homo sapiens (Human)
Collected and cropped from Int J Mol Sci by CiteAb, provided under a CC-BY license
Image 1 of 67
In Int J Mol Sci on 13 June 2024 by Inukai, R., Mori, K., et al.
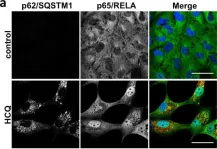
Fig.7.A

-
WB
-
Homo sapiens (Human)
Collected and cropped from Int J Mol Sci by CiteAb, provided under a CC-BY license
Image 1 of 67
In Int J Mol Sci on 13 June 2024 by Inukai, R., Mori, K., et al.
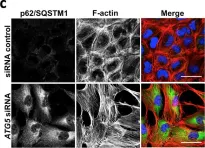
Fig.8.A

-
WB
-
Homo sapiens (Human)
Collected and cropped from Int J Mol Sci by CiteAb, provided under a CC-BY license
Image 1 of 67
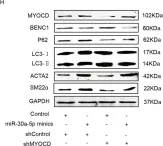
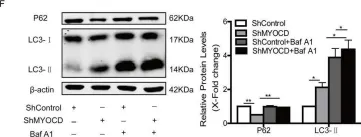
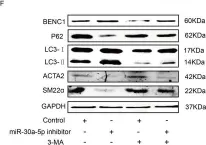
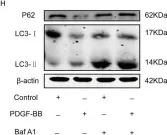
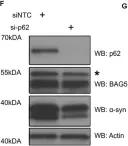
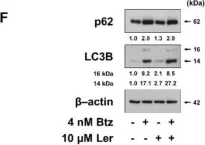
In Cell Death Dis on 8 February 2022 by Shi, D., Ding, J., et al.
Fig.3.H

-
WB
-
Homo sapiens (Human)
Collected and cropped from Cell Death Dis by CiteAb, provided under a CC-BY license
Image 1 of 67
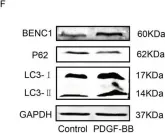
In Cell Death Dis on 8 February 2022 by Shi, D., Ding, J., et al.
Fig.1.F

-
WB
-
Homo sapiens (Human)
Collected and cropped from Cell Death Dis by CiteAb, provided under a CC-BY license
Image 1 of 67
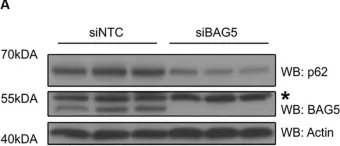
In Cell Death Dis on 8 February 2022 by Shi, D., Ding, J., et al.
Fig.4.F

-
WB
-
Homo sapiens (Human)
Collected and cropped from Cell Death Dis by CiteAb, provided under a CC-BY license
Image 1 of 67
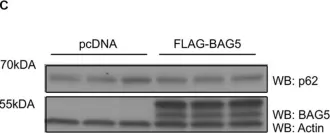
In Cell Death Dis on 8 February 2022 by Shi, D., Ding, J., et al.
Fig.5.H

-
WB
-
Homo sapiens (Human)
Collected and cropped from Cell Death Dis by CiteAb, provided under a CC-BY license
Image 1 of 67
In Cell Death Dis on 8 February 2022 by Shi, D., Ding, J., et al.
Fig.5.F

-
WB
-
Homo sapiens (Human)
Collected and cropped from Cell Death Dis by CiteAb, provided under a CC-BY license
Image 1 of 67
In Front Cell Dev Biol on 28 August 2020 by Friesen, E. L., Zhang, Y. T., et al.
Fig.4.E

-
WB
-
Collected and cropped from Front Cell Dev Biol by CiteAb, provided under a CC-BY license
Image 1 of 67
In Front Cell Dev Biol on 28 August 2020 by Friesen, E. L., Zhang, Y. T., et al.
Fig.3.A

-
WB
-
Collected and cropped from Front Cell Dev Biol by CiteAb, provided under a CC-BY license
Image 1 of 67
In Front Cell Dev Biol on 28 August 2020 by Friesen, E. L., Zhang, Y. T., et al.
Fig.3.C

-
WB
-
Collected and cropped from Front Cell Dev Biol by CiteAb, provided under a CC-BY license
Image 1 of 67
In PLoS One on 25 August 2020 by Kobylarz, M. J., Goodwin, J. M., et al.
Fig.6.D

-
WB
-
Collected and cropped from PLoS One by CiteAb, provided under a CC-BY license
Image 1 of 67
In PLoS One on 25 August 2020 by Kobylarz, M. J., Goodwin, J. M., et al.
Fig.5.F

-
WB
-
Collected and cropped from PLoS One by CiteAb, provided under a CC-BY license
Image 1 of 67
In PLoS One on 25 August 2020 by Kobylarz, M. J., Goodwin, J. M., et al.
Fig.4.D

-
WB
-
Collected and cropped from PLoS One by CiteAb, provided under a CC-BY license
Image 1 of 67
In Elife on 14 August 2020 by Cendrowski, J., Kaczmarek, M., et al.
Fig.4.C

-
WB
-
Collected and cropped from Elife by CiteAb, provided under a CC-BY license
Image 1 of 67
In Elife on 14 August 2020 by Cendrowski, J., Kaczmarek, M., et al.
Fig.4.A

-
WB
-
Mus musculus (House mouse)
Collected and cropped from Elife by CiteAb, provided under a CC-BY license
Image 1 of 67
In Int J Mol Sci on 4 December 2019 by Lee, A. R., Seo, M. J., et al.
Fig.3.F

-
WB
-
Homo sapiens (Human)
Collected and cropped from Int J Mol Sci by CiteAb, provided under a CC-BY license
Image 1 of 67
In Biomolecules on 12 September 2019 by Granato, M., Gilardini Montani, M. S., et al.
Fig.3.A

-
WB
-
Homo sapiens (Human)
Collected and cropped from Biomolecules by CiteAb, provided under a CC-BY license
Image 1 of 67
In Front Oncol on 10 August 2019 by Hwang, M., Jun, D. W., et al.
Fig.1.E

-
WB
-
Homo sapiens (Human)
Collected and cropped from Front Oncol by CiteAb, provided under a CC-BY license
Image 1 of 67
In Front Oncol on 10 August 2019 by Hwang, M., Jun, D. W., et al.
Fig.4.B

-
WB
-
Homo sapiens (Human)
Collected and cropped from Front Oncol by CiteAb, provided under a CC-BY license
Image 1 of 67
In Front Oncol on 10 August 2019 by Hwang, M., Jun, D. W., et al.
Fig.3.B

-
WB
-
Homo sapiens (Human)
Collected and cropped from Front Oncol by CiteAb, provided under a CC-BY license
Image 1 of 67
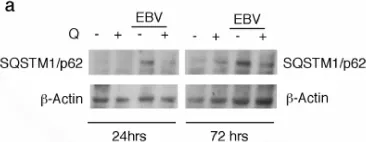
In Cell Death Dis on 7 August 2019 by Hill, C., Li, J., et al.
Fig.4.A

-
ICC-IF
-
Homo sapiens (Human)
Collected and cropped from Cell Death Dis by CiteAb, provided under a CC-BY license
Image 1 of 67
In Cell Death Dis on 7 August 2019 by Hill, C., Li, J., et al.
Fig.3.C

-
ICC-IF
-
Homo sapiens (Human)
Collected and cropped from Cell Death Dis by CiteAb, provided under a CC-BY license
Image 1 of 67
In Cell Death Dis on 25 March 2019 by Zhao, S., Wang, J. M., et al.
Fig.1.B

-
WB
-
Homo sapiens (Human)
Collected and cropped from Cell Death Dis by CiteAb, provided under a CC-BY license
Image 1 of 67