Cyclic AMP-dependent protein kinase A (PKA) is recognized for its pivotal involvement in various cancer types, with Protein Kinase Inhibitor Beta (PKIB) serving as an endogenous inhibitor that curtails PKA activity. Despite the documented escalation of PKIB expression in several malignancies, a comprehensive understanding of its precise mechanistic implications in human cancers remains elusive. This investigation is centered on bladder cancer (BLCA), unveiling an augmented expression of PKIB concomitant with heightened BLCA cell proliferation, migration, and invasion in vitro and augmented tumorigenic potential in an in vivo model. Mechanistically, PKIB disrupts PKA kinase activity, thereby resulting in diminished phosphorylation of the substrate target protein HSP27 at serine 15, 78, and 82. Additionally, the transcription factor MYCN exhibits an affinity for the PKIB promoter, leading to its enhanced expression in the context of BLCA. These findings reveal the oncogenic proclivity of PKIB and introduce a novel signalling pathway in BLCA, providing valuable insights into potential therapeutic targets for precise intervention.
© 2025. The Author(s).
Product Citations: 619
In Cell Death & Disease on 1 July 2025 by Liu, X., Yin, X., et al.
-
WB
-
Homo sapiens (Human)
-
Cancer Research
-
Cell Biology
In Nature Communications on 5 June 2025 by Huang, M. S., LeSavage, B. L., et al.
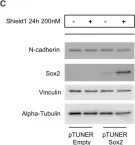
Neural progenitor cells (NPCs) hold immense potential as therapeutic candidates for neural regeneration, and materials-based strategies have emerged as attractive options for NPC expansion. However, maintaining NPC stemness has proven challenging in vitro, due to their propensity to form cell-dense neurospheres. While neurospheres promote cell-cell interactions required for NPC stem maintenance, they also restrict oxygen transport, leading to hypoxia and limited cell expansion. To overcome these limitations, we investigate two materials-based approaches to maintain NPC stemness: 1) physical matrix remodeling within a viscoelastic, stress-relaxing hydrogel and 2) matrix-induced N-cadherin-like signaling through a cell-instructive peptide. While viscoelasticity alone is sufficient to maintain NPC stemness compared to an elastic environment, NPCs still preferentially form neurospheres. The addition of N-cadherin-like peptides promotes a distributed culture of NPCs while maintaining their stemness through cadherin-mediated signaling, ultimately exhibiting improved long-term expansion and neural differentiation. Thus, our findings reveal matrix viscoelasticity and engineered N-cadherin-like interactions as having a synergistic effect on NPC expansion and differentiation within 3D matrices.
© 2025. The Author(s).
In Cell Death and Differentiation on 1 June 2025 by Falvo, P., Gruener, S., et al.
Immunity suffers a function deficit during aging, and the incidence of cancer is increased in the elderly. However, most cancer models employ young mice, which are poorly representative of adult cancer patients. We have previously reported that Triple-Therapy (TT), involving antigen-presenting-cell activation by vinorelbine and generation of TCF1+-stem-cell-like T cells (scTs) by cyclophosphamide significantly improved anti-PD-1 efficacy in anti-PD1-resistant models like Triple-Negative Breast Cancer (TNBC) and Non-Hodgkin's Lymphoma (NHL), due to T-cell-mediated tumor killing. Here, we describe the effect of TT on TNBC growth and on tumor-microenvironment (TME) of young (6-8w, representative of human puberty) versus adult (12 m, representative of 40y-humans) mice. TT-efficacy was similar in young and adults, as CD8+ scTs were only marginally reduced in adults. However, single-cell analyses revealed major differences in the TME: adults had fewer CD4+ scTs, B-naïve and NK-cells, and more memory-B-cells. Cancer-associated-fibroblasts (CAF) with an Extracellular Matrix (ECM) deposition-signature (Matrix-CAFs) were more common in young mice, while pro-inflammatory stromal populations and myofibroblasts were more represented in adults. Matrix-CAFs in adult mice displayed decreased ECM-remodeling abilities, reduced collagen deposition, and a different pattern of interactions with the other cells of the TME. Taken together, our results suggest that age-dependent differences in the TME should be considered when designing preclinical studies.
© 2025. The Author(s).
-
Cancer Research
-
Cell Biology
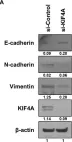
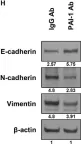
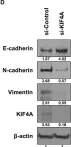
DRP2 promotes EMT and serves as a potential therapeutic target for LUAD treatment.
In Scientific Reports on 13 May 2025 by Chen, Z., Shi, H., et al.
LUAD, a prevalent lung cancer with high mortality, has seen increased focus on molecular targeted therapies due to patient heterogeneity. Among these prospects, dystrophin-associated protein 2 (DRP2), a critical component of the dystrophin complex, underpins membrane-associated structures vital for intercellular interactions in vertebrates. Aberrations in DRP2 function have been linked to the occurrence and development of multiple diseases, prompting an inquiry into its potential link with LUAD progression. To delve into the potential roles of DRP2 in LUAD, we initiated a comprehensive investigation. First, we analyzed DRP2 expression patterns in LUAD using bioinformatics tools. This was subsequently validated through immunohistochemical staining, quantitative PCR, and Western blot analyses. Furthermore, we assessed the functional implications of DRP2 in LUAD cells, both in vitro and in vivo, utilizing assays such as cell cycle analysis, CCK-8 proliferation assay, Colony formation assay EdU incorporation, Transwell migration test, scratch wound healing assay, flow cytometry, and mouse models for tumor xenograft and metastasis. Results showed a strong correlation between high DRP2 expression in LUAD and poorer survival. Notably, DRP2 knockdown accelerated LUAD progression via the EMT pathway. These findings highlight DRP2's crucial role in LUAD and its potential as a therapeutic target.
© 2025. The Author(s).
-
WB
-
Homo sapiens (Human)
Shc1 cooperates with Frs2 and Shp2 to recruit Grb2 in FGF-induced lens development.
In eLife on 6 May 2025 by Wang, Q., Li, H., et al.
Fibroblast growth factor (FGF) signaling elicits multiple downstream pathways, most notably the Ras/MAPK cascade facilitated by the adaptor protein Grb2. However, the mechanism by which Grb2 is recruited to the FGF signaling complex remains unresolved. Here, we showed that genetic ablation of FGF signaling prevented murine lens induction by disrupting transcriptional regulation and actin cytoskeletal arrangements, which could be reproduced by deleting the juxtamembrane region of the FGF receptor and rescued by Kras activation. Conversely, mutations affecting the Frs2-binding site on the FGF receptor or the deletion of Frs2 and Shp2 primarily impact later stages of lens vesicle development involving lens fiber cell differentiation. Our study further revealed that the loss of Grb2 abolished MAPK signaling, resulting in a profound arrest of lens development. However, removing Grb2's putative Shp2 dephosphorylation site (Y209) neither produced a detectable phenotype nor impaired MAPK signaling during lens development. Furthermore, the catalytically inactive Shp2 mutation (C459S) only modestly impaired FGF signaling, whereas replacing Shp2's C-terminal phosphorylation sites (Y542/Y580) previously implicated in Grb2 binding only caused placental defects, perinatal lethality, and reduced lacrimal gland branching without impacting lens development, suggesting that Shp2 only partially mediates Grb2 recruitment. In contrast, we observed that FGF signaling is required for the phosphorylation of the Grb2-binding sites on Shc1 and the deletion of Shc1 exacerbates the lens vesicle defect caused by Frs2 and Shp2 deletion. These findings establish Shc1 as a critical collaborator with Frs2 and Shp2 in targeting Grb2 during FGF signaling.
© 2024, Wang, Li, Mao et al.
-
IHC
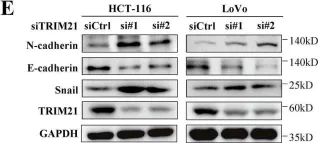
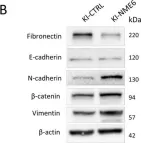
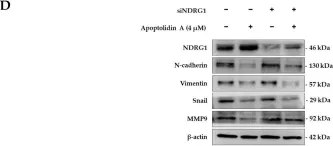
In Cell Death Dis on 31 January 2025 by Cao, M., Shao, Z., et al.
Fig.3.E

-
WB
-
Collected and cropped from Cell Death Dis by CiteAb, provided under a CC-BY license
Image 1 of 155
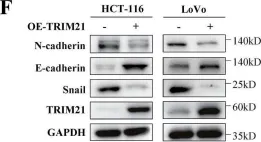
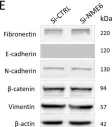
In Cell Death Dis on 31 January 2025 by Cao, M., Shao, Z., et al.
Fig.3.F

-
WB
-
Collected and cropped from Cell Death Dis by CiteAb, provided under a CC-BY license
Image 1 of 155
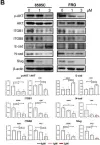
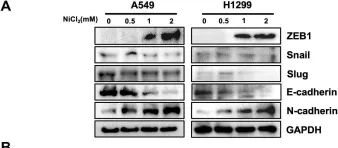
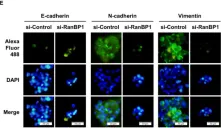
In Pharmaceuticals (Basel) on 18 October 2024 by An, S. C., Jun, H. H., et al.
Fig.5.B

-
WB
-
Collected and cropped from Pharmaceuticals (Basel) by CiteAb, provided under a CC-BY license
Image 1 of 155
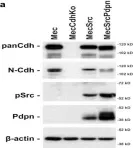
In Sci Rep on 13 October 2024 by Nicoletto, R. E., Holdcraft, C. J., et al.
Fig.1.A

-
WB
-
Mus musculus (House mouse)
Collected and cropped from Sci Rep by CiteAb, provided under a CC-BY license
Image 1 of 155
In Cancers (Basel) on 26 September 2024 by Zhao, X., Han, Z., et al.
Fig.1.A

-
WB
-
Collected and cropped from Cancers (Basel) by CiteAb, provided under a CC-BY license
Image 1 of 155
In Int J Mol Sci on 4 September 2024 by Proust, B., Horvat, A., et al.
Fig.3.B

-
WB
-
Homo sapiens (Human)
Collected and cropped from Int J Mol Sci by CiteAb, provided under a CC-BY license
Image 1 of 155
In Int J Mol Sci on 4 September 2024 by Proust, B., Horvat, A., et al.
Fig.3.E

-
WB
-
Homo sapiens (Human)
Collected and cropped from Int J Mol Sci by CiteAb, provided under a CC-BY license
Image 1 of 155
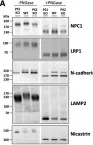
In Int J Mol Sci on 16 May 2024 by Fabiano, M., Oikawa, N., et al.
Fig.4.A

-
WB
-
Collected and cropped from Int J Mol Sci by CiteAb, provided under a CC-BY license
Image 1 of 155
In Elife on 9 April 2024 by Hoving, J. J. A., Harford-Wright, E., et al.
Fig.6.C

-
WB
-
Collected and cropped from Elife by CiteAb, provided under a CC-BY license
Image 1 of 155
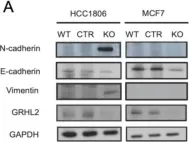
In Cancers (Basel) on 22 November 2023 by Kahm, Y. J., Kim, I. G., et al.
Fig.3.A

-
WB
-
Collected and cropped from Cancers (Basel) by CiteAb, provided under a CC-BY license
Image 1 of 155
In Cancers (Basel) on 22 November 2023 by Kahm, Y. J., Kim, I. G., et al.
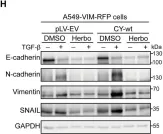
Fig.4.H

-
WB
-
Collected and cropped from Cancers (Basel) by CiteAb, provided under a CC-BY license
Image 1 of 155
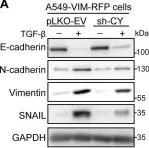
In Cancers (Basel) on 22 November 2023 by Kahm, Y. J., Kim, I. G., et al.
Fig.5.D

-
WB
-
Collected and cropped from Cancers (Basel) by CiteAb, provided under a CC-BY license
Image 1 of 155
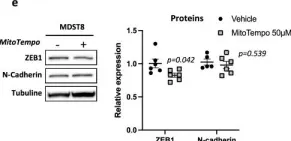
In J Transl Med on 3 August 2023 by Bastin, J., Sroussi, M., et al.
Fig.3.E

-
WB
-
Collected and cropped from J Transl Med by CiteAb, provided under a CC-BY license
Image 1 of 155
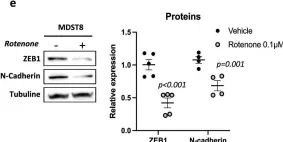
In J Transl Med on 3 August 2023 by Bastin, J., Sroussi, M., et al.
Fig.2.E

-
WB
-
Collected and cropped from J Transl Med by CiteAb, provided under a CC-BY license
Image 1 of 155
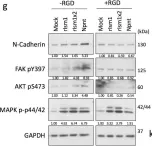
In Nat Commun on 25 April 2023 by Gao, G., Li, X., et al.
Fig.7.G

-
WB
-
Collected and cropped from Nat Commun by CiteAb, provided under a CC-BY license
Image 1 of 155
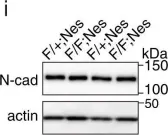
In Commun Biol on 21 April 2023 by Maejima, I., Hara, T., et al.
Fig.5.I

-
WB
-
Mus musculus (House mouse)
Collected and cropped from Commun Biol by CiteAb, provided under a CC-BY license
Image 1 of 155
In Int J Mol Sci on 6 April 2023 by Kahm, Y. J., Kim, I. G., et al.
Fig.5.E

-
ICC-IF
-
Homo sapiens (Human)
Collected and cropped from Int J Mol Sci by CiteAb, provided under a CC-BY license
Image 1 of 155
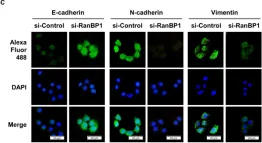
In Int J Mol Sci on 6 April 2023 by Kahm, Y. J., Kim, I. G., et al.
Fig.3.C

-
ICC-IF
-
Homo sapiens (Human)
Collected and cropped from Int J Mol Sci by CiteAb, provided under a CC-BY license
Image 1 of 155
In Physiol Rep on 1 April 2023 by Yokokawa, T., Kido, K., et al.
Fig.5.B

-
WB
-
Mus musculus (House mouse)
Collected and cropped from Physiol Rep by CiteAb, provided under a CC-BY license
Image 1 of 155
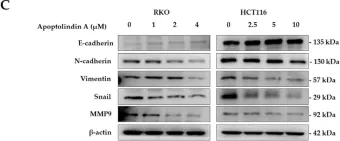
In Pharmaceuticals (Basel) on 26 March 2023 by Kyaw, K. Z., Park, J., et al.
Fig.6.D

-
WB
-
Collected and cropped from Pharmaceuticals (Basel) by CiteAb, provided under a CC-BY license
Image 1 of 155
In Pharmaceuticals (Basel) on 26 March 2023 by Kyaw, K. Z., Park, J., et al.
Fig.5.C

-
WB
-
Collected and cropped from Pharmaceuticals (Basel) by CiteAb, provided under a CC-BY license
Image 1 of 155
In Int J Mol Sci on 28 January 2023 by Wang, Z., Coban, B., et al.
Fig.6.A

-
WB
-
Collected and cropped from Int J Mol Sci by CiteAb, provided under a CC-BY license
Image 1 of 155
In Cell Mol Life Sci on 17 January 2023 by Zhang, J., Van Dinther, M., et al.
Fig.6.H

-
WB
-
Collected and cropped from Cell Mol Life Sci by CiteAb, provided under a CC-BY license
Image 1 of 155
In Cell Mol Life Sci on 17 January 2023 by Zhang, J., Van Dinther, M., et al.
Fig.3.A

-
WB
-
Collected and cropped from Cell Mol Life Sci by CiteAb, provided under a CC-BY license
Image 1 of 155
In Cell Mol Life Sci on 17 January 2023 by Zhang, J., Van Dinther, M., et al.
Fig.2.A

-
WB
-
Collected and cropped from Cell Mol Life Sci by CiteAb, provided under a CC-BY license
Image 1 of 155