Chromocenters in mouse cells are membrane-less nuclear compartments representing typical heterochromatin stably maintained during cell cycle. We explore how histone H3 variants, replicative H3.1/2 or replacement H3.3, mark these domains during the cell cycle in mouse embryonic stem cells, neuronal precursor cells as well as immortalized 3T3 cells. We find a strong and distinct H3.1 enrichment at chromocenters, with variation in mouse embryonic stem cells. Mechanistically, this H3.1 selective enrichment depends on the DNA Synthesis Coupled deposition pathway operating in S phase challenged when we target H3.3 deposition through the DNA Synthesis Independent deposition pathway mediated by HIRA. Altering the H3.1/H3.3 dynamics at chromocenters in mouse embryonic stem cells affects nuclear morphology and cell division. Here, we reveal opposing mechanisms for H3.1 and H3.3 deposition with different enforcement according to cell cycle and potency which determine their ratio at chromocenters and are critical for genome stability and cell survival.
© 2025. The Author(s).
Product Citations: 75
In Nature Communications on 3 June 2025 by Arfè, S., Karagyozova, T., et al.
-
WB
-
Stem Cells and Developmental Biology
The role of KLF4 in human primordial germ cell development.
In Open Biology on 1 January 2025 by Lee, S. M., Smela, M. P., et al.
Primordial germ cells (PGCs) are the founder cells that develop into mature gametes. PGCs emerge during weeks 2-3 of human embryo development. Pluripotency genes are reactivated during PGC specification, including Krüppel-like factor KLF4, but its precise role in PGC development is unclear. Here, we investigated the role of KLF4 in PGC development using our in vitro model for human PGC-like cells (hPGCLCs). We demonstrate that the depletion of KLF4 reduces the efficiency of hPGCLC specification, resulting in hPGCLCs with an aberrant transcriptome. Cut-and-run and transcriptomic analyses reveal that KLF4 represses somatic markers involved in neuronal and endodermal differentiation while promoting the expression of genes associated with PGC specification, such as PAX5, and epigenetic regulators, including DNMT3L and REST. KLF4 targets in hPGCLCs showed significant co-enrichment of motifs for SP and STAT factors, which are known to regulate cell cycle and migration genes. KLF4 contributes to human PGC development by activating genes involved in PGC specification and cell cycle regulation, while repressing somatic genes to maintain PGC identity.
Multiplex Genome Editing of Human Pluripotent Stem Cells Using Cpf1.
In Bio-protocol on 20 November 2024 by Ma, H.
Targeted genome editing of human pluripotent stem cells (hPSCs) is critical for basic and translational research and can be achieved with site-specific endonucleases. Cpf1 (CRISPR from Prevotella and Francisella) is a programmable DNA endonuclease with AT-rich PAM sequences. In this protocol, we describe procedures for using a single vector system to deliver Cpf1 and CRISPR RNA (crRNA) for genome editing in hPSCs. This protocol enables indel formation and homologous recombination-mediated precise editing at multiple loci. With the delivery of Cpf1 and a single U6 promoter-driven guide RNA array composed of an AAVS1-targeting and a MAFB-targeting crRNA array, efficient multiplex genome editing at the AAVS1 (knockin) and MAFB (knockout) loci in hPSCs could be achieved in a single experiment. The edited hPSCs expressed pluripotency markers and could differentiate into neurons in vitro. This system also generated INS reporter hPSCs with a 6 kb cassette knockin at the INS locus. The INS reporter cells can differentiate into β-cells that express tdTomato and luciferase, permitting fluorescence-activated cell sorting of hPSC-β-cells. By targeted screening of potential off-target sequences that are most homologous to crRNA sequences, no off-target mutations were detected in any of the tested sequences. This work provides an efficient and flexible system for precise genome editing in mammalian cells including hPSCs with the benefits of less off-target effects. Key features • A single-vector system to deliver Cpf1 and crRNA enables the sorting of transfected cells • Efficient and simultaneous multi-modular genome editing exemplified by mutation of MAFB and knockin of AAVS1 loci in a single experiment • Edited PSCs showed minimal off-target effects and can be differentiated into multiple cell types.
©Copyright : © 2024 The Authors; This is an open access article under the CC BY-NC license.
-
Stem Cells and Developmental Biology
In Cell Systems on 15 May 2024 by Camacho-Aguilar, E., Yoon, S. T., et al.
BMP signaling is essential for mammalian gastrulation, as it initiates a cascade of signals that control self-organized patterning. As development is highly dynamic, it is crucial to understand how time-dependent combinatorial signaling affects cellular differentiation. Here, we show that BMP signaling duration is a crucial control parameter that determines cell fates upon the exit from pluripotency through its interplay with the induced secondary signal WNT. BMP signaling directly converts cells from pluripotent to extraembryonic fates while simultaneously upregulating Wnt signaling, which promotes primitive streak and mesodermal specification. Using live-cell imaging of signaling and cell fate reporters together with a simple mathematical model, we show that this circuit produces a temporal morphogen effect where, once BMP signal duration is above a threshold for differentiation, intermediate and long pulses of BMP signaling produce specification of mesoderm and extraembryonic fates, respectively. Our results provide a systems-level picture of how these signaling pathways control the landscape of early human development.
Copyright © 2024 Elsevier Inc. All rights reserved.
In Frontiers in Cell and Developmental Biology on 27 December 2023 by Niwa, R., Sakai, K., et al.
Severe Acute Respiratory Syndrome Coronavirus 2 (SARS-CoV-2), the causative agent of COVID-19, continues to spread around the world with serious cases and deaths. It has also been suggested that different genetic variants in the human genome affect both the susceptibility to infection and severity of disease in COVID-19 patients. Angiotensin-converting enzyme 2 (ACE2) has been identified as a cell surface receptor for SARS-CoV and SARS-CoV-2 entry into cells. The construction of an experimental model system using human iPS cells would enable further studies of the association between viral characteristics and genetic variants. Airway and alveolar epithelial cells are cell types of the lung that express high levels of ACE2 and are suitable for in vitro infection experiments. Here, we show that human iPS cell-derived airway and alveolar epithelial cells are highly susceptible to viral infection of SARS-CoV-2. Using gene knockout with CRISPR-Cas9 in human iPS cells we demonstrate that ACE2 plays an essential role in the airway and alveolar epithelial cell entry of SARS-CoV-2 in vitro. Replication of SARS-CoV-2 was strongly suppressed in ACE2 knockout (KO) lung cells. Our model system based on human iPS cell-derived lung cells may be applied to understand the molecular biology regulating viral respiratory infection leading to potential therapeutic developments for COVID-19 and the prevention of future pandemics.
Copyright © 2023 Niwa, Sakai, Lung, Matsumoto, Mikawa, Maehana, Suzuki, Yamamoto, Maurissen, Hirabayashi, Noda, Kubo, Gotoh and Woltjen.
-
COVID-19
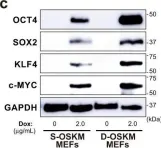
In Nat Commun on 19 August 2021 by Taguchi, J., Shibata, H., et al.
Fig.1.C

-
WB
-
Collected and cropped from Nat Commun by CiteAb, provided under a CC-BY license
Image 1 of 6
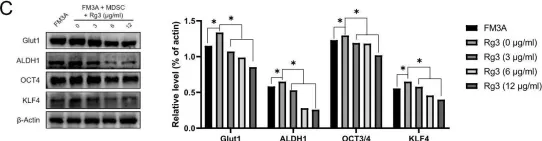
In PLoS One on 23 October 2020 by Song, J. H., Eum, D. Y., et al.
Fig.2.C

-
WB
-
Collected and cropped from PLoS One by CiteAb, provided under a CC-BY license
Image 1 of 6
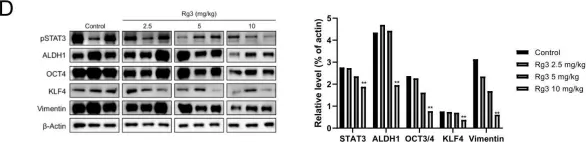
In PLoS One on 23 October 2020 by Song, J. H., Eum, D. Y., et al.
Fig.5.D

-
WB
-
Collected and cropped from PLoS One by CiteAb, provided under a CC-BY license
Image 1 of 6
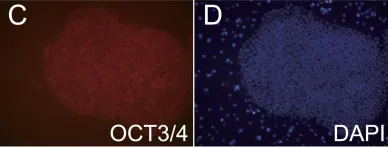
In PLoS One on 31 May 2019 by Yabe, S. G., Nishida, J., et al.
Fig.2.C

-
IHC-IF
-
Homo sapiens (Human)
Collected and cropped from PLoS One by CiteAb, provided under a CC-BY license
Image 1 of 6
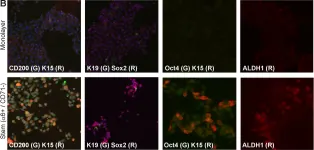
In PLoS One on 1 January 2014 by Adhikary, G., Grun, D., et al.
Fig.3.B

-
ICC-IF
-
Homo sapiens (Human)
Collected and cropped from PLoS One by CiteAb, provided under a CC-BY license
Image 1 of 6
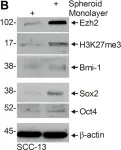
In PLoS One on 1 January 2014 by Adhikary, G., Grun, D., et al.
Fig.2.B

-
WB
-
Homo sapiens (Human)
Collected and cropped from PLoS One by CiteAb, provided under a CC-BY license
Image 1 of 6