Crossing the blood-brain barrier (BBB) and reaching intracranial tumours is a clinical challenge for current targeted interventions including antibody-based therapies, contributing to poor patient outcomes. Increased cell surface density of human epidermal growth factor receptor 3 (HER3) is associated with a growing number of metastatic tumour types and is observed on tumour cells that acquire resistance to a growing number of clinical targeted therapies. Here we describe the evaluation of HER3-homing nanobiological particles (nanobioparticles (NBPs)) on such tumours in preclinical models and our discovery that systemic NBPs could be found in the brain even in the absence of such tumours. Our subsequent studies described here show that HER3 is prominently associated with both mouse and human brain endothelium and with extravasation of systemic NBPs in mice and in human-derived BBB chips in contrast to non-targeted agents. In mice, systemically delivered NBPs carrying tumoricidal agents reduced the growth of intracranial triple-negative breast cancer cells, which also express HER3, with improved therapeutic profile compared to current therapies and compared to agents using traditional BBB transport routes. As HER3 associates with a growing number of metastatic tumours, the NBPs described here may offer targeted efficacy especially when such tumours localize to the brain.
© 2025. The Author(s).
Product Citations: 192
In Nature Nanotechnology on 1 May 2025 by Alonso-Valenteen, F., Mikhael, S., et al.
-
Cancer Research
In Nature Communications on 11 March 2025 by Naghdi, S., Mishra, P., et al.
Differences between normal tissues and invading tumors that allow tumor targeting while saving normal tissue are much sought after. Here we show that scarcity of VDAC2, and the consequent lack of Bak recruitment to mitochondria, renders hepatocyte mitochondria resistant to permeabilization by truncated Bid (tBid), a Bcl-2 Homology 3 (BH3)-only, Bcl-2 family protein. Increased VDAC2 and Bak is found in most human liver cancers and mitochondria from tumors and hepatic cancer cell lines exhibit VDAC2- and Bak-dependent tBid sensitivity. Exploring potential therapeutic targeting, we find that combinations of activators of the tBid pathway with inhibitors of the Bcl-2 family proteins that suppress Bak activation enhance VDAC2-dependent death of hepatocarcinoma cells with little effect on normal hepatocytes. Furthermore, in vivo, combination of S63845, a selective Mcl-1 inhibitor, with tumor-nectrosis factor-related, apoptosis-induncing ligand (TRAIL) peptide reduces tumor growth, but only in tumors expressing VDAC2. Thus, we describe mitochondrial molecular fingerprint that discriminates liver from hepatocarcinoma and allows sparing normal tissue while targeting tumors.
© 2025. The Author(s).
-
WB
-
Mus musculus (House mouse)
-
Rattus norvegicus (Rat)
-
Cancer Research
-
Cell Biology
Preprint on BioRxiv : the Preprint Server for Biology on 16 February 2025 by Richert, A. C., Zhang, Y., et al.
ABSTRACT Glutaric aciduria type-1 (GA1) is an inherited mitochondrial neurometabolic disorder with a poorly understood pathogenesis and unmet medical needs. GA1 can be diagnosed via its hallmark biochemical signature consisting of glutaric aciduria, 3-hydroxyglutaric aciduria, and increased plasma glutarylcarnitine. These glutaryl-CoA-derived metabolites are thought to originate solely in the mitochondria. Here, we demonstrate that wild-type mice fed an 11-carbon odd-chain dicarboxylic acid (undecanedioic acid, DC 11 ) recreates the biochemical phenotype of GA1. Odd-chain dicarboxylic acids like DC 11 are not present in food but can arise from several endogenous processes, such as lipid peroxidation and fatty acid ω-oxidation. DC 11 is chain-shortened in peroxisomes to glutaryl (DC 5 )-CoA, which then gives rise to the GA1-like pattern of DC 5 metabolites in urine, tissues, and blood. Glutaric acid released from peroxisomes during DC 11 chain-shortening can enter mitochondria, be activated to CoA by the enzyme succinyl-CoA:glutarate-CoA transferase (SUGCT), and become substrate for glutaryl-CoA dehydrogenase (GCDH), the enzyme that is mutated in GA1. Our data provide proof-of-concept that the generation of dicarboxylic acids by ω-oxidation, which is stimulated during the same catabolic states known to trigger acute encephalopathy in GA1, may exacerbate disease by increasing the glutaryl-CoA substrate load in mitochondria.
-
Biochemistry and Molecular biology
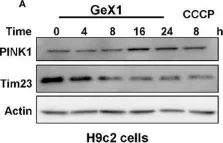
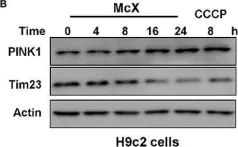
Glucose-6-phosphate dehydrogenase regulates mitophagy by maintaining PINK1 stability.
In Life Metabolism on 1 February 2025 by Cho, Y. L., Tan, H. W. S., et al.
Glucose-6-phosphate dehydrogenase (G6PD) is the rate-limiting enzyme in the pentose phosphate pathway (PPP) in glycolysis. Glucose metabolism is closely implicated in the regulation of mitophagy, a selective form of autophagy for the degradation of damaged mitochondria. The PPP and its key enzymes such as G6PD possess important metabolic functions, including biosynthesis and maintenance of intracellular redox balance, while their implication in mitophagy is largely unknown. Here, via a whole-genome CRISPR-Cas9 screening, we identified that G6PD regulates PINK1 (phosphatase and tensin homolog [PTEN]-induced kinase 1)-Parkin-mediated mitophagy. The function of G6PD in mitophagy was verified via multiple approaches. G6PD deletion significantly inhibited mitophagy, which can be rescued by G6PD reconstitution. Intriguingly, while the catalytic activity of G6PD is required, the known PPP functions per se are not involved in mitophagy regulation. Importantly, we found a portion of G6PD localized at mitochondria where it interacts with PINK1. G6PD deletion resulted in an impairment in PINK1 stabilization and subsequent inhibition of ubiquitin phosphorylation, a key starting point of mitophagy. Finally, we found that G6PD deletion resulted in lower cell viability upon mitochondrial depolarization, indicating the physiological function of G6PD-mediated mitophagy in response to mitochondrial stress. In summary, our study reveals a novel role of G6PD as a key positive regulator in mitophagy, which bridges several important cellular processes, namely glucose metabolism, redox homeostasis, and mitochondrial quality control.
© The Author(s) 2024. Published by Oxford University Press on behalf of Higher Education Press.
-
Homo sapiens (Human)
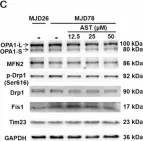
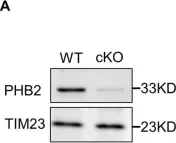
OCIAD1 and prohibitins regulate the stability of the TIM23 protein translocase.
In Cell Reports on 24 December 2024 by Elancheliyan, P., Maruszczak, K. K., et al.
Mitochondrial proteins are transported and sorted to the matrix or inner mitochondrial membrane by the presequence translocase TIM23. In yeast, this essential and highly conserved machinery is composed of the core subunits Tim23 and Tim17. The architecture, assembly, and regulation of the human TIM23 complex are poorly characterized. The human genome encodes two paralogs, TIMM17A and TIMM17B. Here, we describe an unexpected role of the ovarian cancer immunoreactive antigen domain-containing protein 1 (OCIAD1) and the prohibitin complex in the biogenesis of human TIM23. Prohibitins were required to stabilize both the TIMM17A- and TIMM17B-containing variants of the translocase. Interestingly, OCIAD1 assembled with the prohibitin complex to protect the TIMM17A variant from degradation by the YME1L protease. The expression of OCIAD1 was in turn regulated by the status of the TIM23 complex. We postulate that OCIAD1 together with prohibitins constitute a regulatory axis that differentially regulates variants of human TIM23.
Copyright © 2024 The Authors. Published by Elsevier Inc. All rights reserved.
In Biomolecules on 26 November 2024 by Zhang, Y., Zhang, B. B., et al.
Fig.3.A

-
WB
-
Collected and cropped from Biomolecules by CiteAb, provided under a CC-BY license
Image 1 of 55
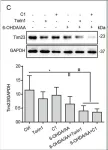
In Sci Rep on 29 October 2024 by Lin, Y., Cheng, W., et al.
Fig.4.C

-
WB
-
Collected and cropped from Sci Rep by CiteAb, provided under a CC-BY license
Image 1 of 55
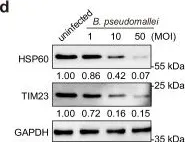
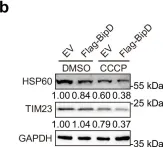
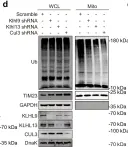
In Nat Commun on 4 June 2024 by Nan, D., Rao, C., et al.
Fig.1.D

-
WB
-
Collected and cropped from Nat Commun by CiteAb, provided under a CC-BY license
Image 1 of 55
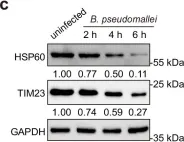
In Nat Commun on 4 June 2024 by Nan, D., Rao, C., et al.
Fig.1.C

-
WB
-
Collected and cropped from Nat Commun by CiteAb, provided under a CC-BY license
Image 1 of 55
In Nat Commun on 4 June 2024 by Nan, D., Rao, C., et al.
Fig.3.B

-
WB
-
Collected and cropped from Nat Commun by CiteAb, provided under a CC-BY license
Image 1 of 55
In Nat Commun on 4 June 2024 by Nan, D., Rao, C., et al.
Fig.5.D

-
WB
-
Collected and cropped from Nat Commun by CiteAb, provided under a CC-BY license
Image 1 of 55
In Cells on 5 September 2023 by Luo, Z. Y., Jiang, T. X., et al.
Fig.7.B

-
WB
-
Mus musculus (House mouse)
Collected and cropped from Cells by CiteAb, provided under a CC-BY license
Image 1 of 55
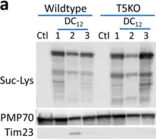
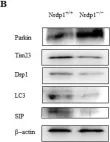
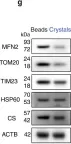
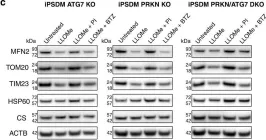
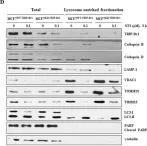
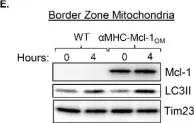
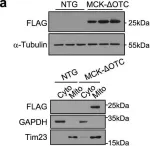
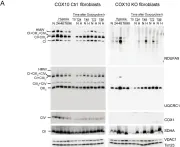
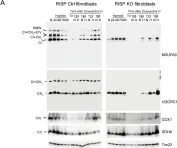
In Elife on 2 May 2023 by Coyne, L. P., Wang, X., et al.
Fig.8.D

-
WB
-
Collected and cropped from Elife by CiteAb, provided under a CC-BY license
Image 1 of 55
In Nat Commun on 28 November 2022 by Bussi, C., Heunis, T., et al.
Fig.6.G

-
WB
-
Collected and cropped from Nat Commun by CiteAb, provided under a CC-BY license
Image 1 of 55
In Nat Commun on 28 November 2022 by Bussi, C., Heunis, T., et al.
Fig.1.C

-
WB
-
Collected and cropped from Nat Commun by CiteAb, provided under a CC-BY license
Image 1 of 55
In Int J Biol Sci on 12 July 2022 by Jung, S., Myagmarjav, D., et al.
Fig.6.D

-
WB
-
Collected and cropped from Int J Biol Sci by CiteAb, provided under a CC-BY license
Image 1 of 55
In Cells on 27 April 2022 by Moyzis, A. G., Lally, N. S., et al.
Fig.2.E

-
WB
-
Mus musculus (House mouse)
Collected and cropped from Cells by CiteAb, provided under a CC-BY license
Image 1 of 55
In Nat Commun on 16 February 2022 by Xu, Z., Fu, T., et al.
Fig.7.A

-
WB
-
Collected and cropped from Nat Commun by CiteAb, provided under a CC-BY license
Image 1 of 55
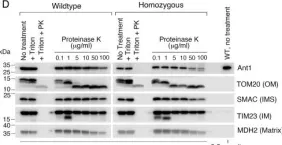
In Cells on 29 September 2020 by Saldana-Caboverde, A., Nissanka, N., et al.
Fig.7.A

-
WB
-
Collected and cropped from Cells by CiteAb, provided under a CC-BY license
Image 1 of 55
In Cells on 29 September 2020 by Saldana-Caboverde, A., Nissanka, N., et al.
Fig.6.A

-
WB
-
Collected and cropped from Cells by CiteAb, provided under a CC-BY license
Image 1 of 55
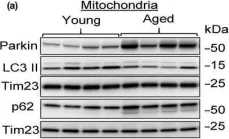
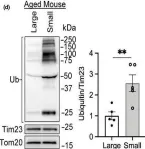
In Aging Cell on 1 August 2020 by Liang, W., Moyzis, A. G., et al.
Fig.4.A

-
WB
-
Collected and cropped from Aging Cell by CiteAb, provided under a CC-BY license
Image 1 of 55
In Aging Cell on 1 August 2020 by Liang, W., Moyzis, A. G., et al.
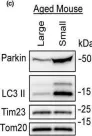
Fig.5.D

-
WB
-
Collected and cropped from Aging Cell by CiteAb, provided under a CC-BY license
Image 1 of 55
In Aging Cell on 1 August 2020 by Liang, W., Moyzis, A. G., et al.
Fig.5.C

-
WB
-
Collected and cropped from Aging Cell by CiteAb, provided under a CC-BY license
Image 1 of 55
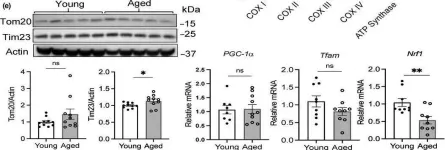
In Aging Cell on 1 August 2020 by Liang, W., Moyzis, A. G., et al.
Fig.4.E

-
WB
-
Collected and cropped from Aging Cell by CiteAb, provided under a CC-BY license
Image 1 of 55
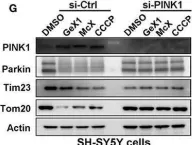
In Front Pharmacol on 1 May 2020 by Xiang, Q., Wu, M., et al.
Fig.4.G

-
WB
-
Collected and cropped from Front Pharmacol by CiteAb, provided under a CC-BY license
Image 1 of 55
In Front Pharmacol on 1 May 2020 by Xiang, Q., Wu, M., et al.
Fig.5.A

-
WB
-
Collected and cropped from Front Pharmacol by CiteAb, provided under a CC-BY license
Image 1 of 55
In Front Pharmacol on 1 May 2020 by Xiang, Q., Wu, M., et al.
Fig.5.B

-
WB
-
Collected and cropped from Front Pharmacol by CiteAb, provided under a CC-BY license
Image 1 of 55
In Cells on 21 April 2020 by Morganti, C., Bonora, M., et al.
Fig.2.A

-
WB
-
Collected and cropped from Cells by CiteAb, provided under a CC-BY license
Image 1 of 55
In Cell Death Dis on 12 March 2020 by Wu, D., Jian, C., et al.
Fig.1.A

-
WB
-
Mus musculus (House mouse)
Collected and cropped from Cell Death Dis by CiteAb, provided under a CC-BY license
Image 1 of 55
In Cell Death Dis on 18 February 2020 by Zhuang, X. X., Wang, S. F., et al.
Fig.8.C

-
WB
-
Collected and cropped from Cell Death Dis by CiteAb, provided under a CC-BY license
Image 1 of 55