SARS-CoV-2 hijacks multiple organelles for virion assembly, of which the mechanisms have not been fully understood. Here, we identified a SARS-CoV-2-driven membrane structure named the 3a dense body (3DB). 3DBs are unusual electron-dense and dynamic structures driven by the accessory protein ORF3a via remodeling a specific subset of the trans-Golgi network (TGN) and early endosomal membrane. 3DB formation is conserved in related bat and pangolin coronaviruses but was lost during the evolution to SARS-CoV. During SARS-CoV-2 infection, 3DB recruits the viral structural proteins spike (S) and membrane (M) and undergoes dynamic fusion/fission to maintain the optimal unprocessed-to-processed ratio of S on assembled virions. Disruption of 3DB formation resulted in virions assembled with an abnormal S processing rate, leading to a dramatic reduction in viral entry efficiency. Our study uncovers the crucial role of 3DB in maintaining maximal SARS-CoV-2 infectivity and highlights its potential as a target for COVID-19 prophylactics and therapeutics.
© 2025. The Author(s).
Product Citations: 76
SARS-CoV-2 ORF3a drives dynamic dense body formation for optimal viral infectivity.
In Nature Communications on 12 May 2025 by Hartmann, S., Radochonski, L., et al.
-
COVID-19
-
Immunology and Microbiology
In Traffic (Copenhagen, Denmark) on 18 March 2025 by Khakurel, A., Pokrovskaya, I., et al.
The GARP complex is an evolutionarily conserved protein complex proposed to tether endosome-derived vesicles at the trans-Golgi network. While complete depletion of the GARP leads to severe trafficking and glycosylation defects, the primary defects linked to GARP dysfunction remain unclear. In this study, we utilized the mAID degron strategy to achieve rapid degradation of VPS54 in human cells, acutely disrupting GARP function. This resulted in the partial mislocalization and degradation of a subset of Golgi-resident proteins, including TGN46, ATP7A, TMEM87A, CPD, C1GALT1 and GS15. Enzyme recycling defects led to O-glycosylation abnormalities. Additionally, while fibronectin and cathepsin D secretion were altered, mannose-6-phosphate receptors were largely unaffected. Partial displacement of COPI, AP1 and GGA coats caused a significant accumulation of vesicle-like structures and large vacuoles. Electron microscopy detection of GARP-dependent vesicles and identifying specific cargo proteins provide direct experimental evidence of GARP's role as a vesicular tether. We conclude that the primary defects of GARP dysfunction involve vesicular coat mislocalization, accumulation of GARP-dependent vesicles, degradation and mislocalization of specific Golgi proteins and O-glycosylation defects.
© 2025 The Author(s). Traffic published by John Wiley & Sons Ltd.
-
Cell Biology
In Tumour Virus Research on 1 December 2024 by Li, S., Williamson, Z. L., et al.
High risk human papillomavirus (HPV) infection is responsible for 99 % of cervical cancers and 5 % of all human cancers worldwide. HPV infection requires the viral genome (vDNA) to gain access to nuclei of basal keratinocytes of epithelium. After virion endocytosis, the minor capsid protein L2 dictates the subcellular retrograde trafficking and nuclear localization of the vDNA during mitosis. Prior work identified a cell-permeable peptide termed SNX1.3, derived from the BAR domain of sorting nexin 1 (SNX1), that potently blocks the retrograde and nuclear trafficking of EGFR in triple negative breast cancer cells. Given the importance of EGFR and retrograde trafficking pathways in HPV16 infection, we set forth to study the effects of SNX1.3 within this context. SNX1.3 inhibited HPV16 infection by both delaying virion endocytosis, as well as potently blocking virion retrograde trafficking and Golgi localization. SNX1.3 had no effect on cell proliferation, nor did it affect post-Golgi trafficking of HPV16. Looking more directly at L2 function, SNX1.3 was found to impair membrane spanning of the minor capsid protein. Future work will focus on mechanistic studies of SNX1.3 inhibition, and the role of EGFR signaling and SNX1-mediated endosomal tubulation, cargo sorting, and retrograde trafficking in HPV infection.
Copyright © 2024 The Authors. Published by Elsevier B.V. All rights reserved.
-
ICC-IF
YIPF3 and YIPF4 regulate autophagic turnover of the Golgi apparatus.
In The EMBO Journal on 1 July 2024 by Kitta, S., Kaminishi, T., et al.
The degradation of organelles by autophagy is essential for cellular homeostasis. The Golgi apparatus has recently been demonstrated to be degraded by autophagy, but little is known about how the Golgi is recognized by the forming autophagosome. Using quantitative proteomic analysis and two novel Golgiphagy reporter systems, we found that the five-pass transmembrane Golgi-resident proteins YIPF3 and YIPF4 constitute a Golgiphagy receptor. The interaction of this complex with LC3B, GABARAP, and GABARAPL1 is dependent on a LIR motif within YIPF3 and putative phosphorylation sites immediately upstream; the stability of the complex is governed by YIPF4. Expression of a YIPF3 protein containing a mutated LIR motif caused an elongated Golgi morphology, indicating the importance of Golgi turnover via selective autophagy. The reporter assays reported here may be readily adapted to different experimental contexts to help deepen our understanding of Golgiphagy.
© 2024. The Author(s).
-
Cell Biology
In Biological Pharmaceutical Bulletin on 13 June 2024 by Hayashi, Y., Suzuki, T., et al.
Ceramide (Cer) is synthesized de novo in the bilayer of the endoplasmic reticulum and transported to the cytosolic leaflet of the trans-Golgi apparatus for sphingomyelin (SM) synthesis. As the active site of SM synthase (SMS) is located on the luminal side of the Golgi membrane, Cer translocates to the lumen via transbilayer movement for SM synthesis. However, the mechanism of transbilayer movement is not fully understood. As the Cer-related translocases seem to localize near the SMS, the protein was identified using proximity-dependent biotin identification proteomics. Phospholipid scramblase 1 (PLSCR1), which is thought to act as a scramblase for phosphatidylserine and phosphatidylethanolamine, was identified as a protein proximal to the SMS isoforms SMS1 and SMS2. Although five isoforms of PLSCR have been reported in humans, only PLSCR1, PLSCR3, and PLSCR4 are expressed in HEK293T cells. Confocal microscopic analysis showed that PLSCR1 and PLSCR4 partially co-localized with p230, a trans-Golgi network marker, where SMS isoforms are localized. We established CRISPR/Cas9-mediated PLSCR1, PLSCR3, and PLSCR4 single-knockout cells and PLSCR1, 3, 4 triple knockout HEK293T cells. Liquid chromatography-tandem mass spectrometry revealed that the levels of species with distinct acyl chains in Cer and SM were not significantly different in single knockout cells or in the triple knockout cells compared to the wild-type cells. Our findings suggest that PLSCR1 is localized in the vicinity of SMS isoforms, however is not involved in the transbilayer movement of Cer for SM synthesis.
-
Homo sapiens (Human)
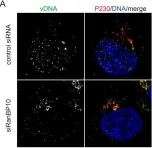
In PLoS Pathog on 1 May 2021 by Lai, K. Y., Rizzato, M., et al.
Fig.3.A

-
ICC-IF
-
Collected and cropped from PLoS Pathog by CiteAb, provided under a CC-BY license
Image 1 of 3
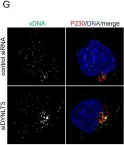
In PLoS Pathog on 1 May 2021 by Lai, K. Y., Rizzato, M., et al.
Fig.7.G

-
ICC-IF
-
Collected and cropped from PLoS Pathog by CiteAb, provided under a CC-BY license
Image 1 of 3
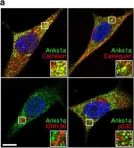
In Nat Commun on 13 September 2016 by Lee, H., Noh, H., et al.
Fig.1.A

-
ICC-IF
-
Collected and cropped from Nat Commun by CiteAb, provided under a CC-BY license
Image 1 of 3