The cellular protein GBF1, an activator of Arf GTPases (ArfGEF: Arf guanine nucleotide exchange factor), is recruited to the replication organelles of enteroviruses through interaction with the viral protein 3A, and its ArfGEF activity is required for viral replication, however how GBF1-dependent Arf activation supports the infection remains enigmatic. Here, we investigated the development of resistance of poliovirus, a prototype enterovirus, to increasing concentrations of brefeldin A (BFA), an inhibitor of GBF1. High level of resistance required a gradual accumulation of multiple mutations in the viral protein 2C. The 2C mutations conferred BFA resistance even in the context of a 3A mutant previously shown to be defective in the recruitment of GBF1 to replication organelles, and in cells depleted of GBF1, suggesting a GBF1-independent replication mechanism. Still, activated Arfs accumulated on the replication organelles of this mutant even in the presence of BFA, its replication was inhibited by a pan-ArfGEF inhibitor LM11, and the BFA-resistant phenotype was compromised in Arf1-knockout cells. Importantly, the mutations strongly increased the interaction of 2C with the activated form of Arf1. Analysis of other enteroviruses revealed a particularly strong interaction of 2C of human rhinovirus 1A with activated Arf1. Accordingly, the replication of this virus was significantly less sensitive to BFA than that of poliovirus. Thus, our data demonstrate that enterovirus 2Cs may behave like Arf1 effector proteins and that GBF1 but not Arf activation can be dispensable for enterovirus replication. These findings have important implications for the development of host-targeted anti-viral therapeutics.
Copyright: © 2023 Viktorova et al. This is an open access article distributed under the terms of the Creative Commons Attribution License, which permits unrestricted use, distribution, and reproduction in any medium, provided the original author and source are credited.
Product Citations: 30
In PLoS Pathogens on 1 September 2023 by Viktorova, E. G., Gabaglio, S., et al.
-
Homo sapiens (Human)
-
Immunology and Microbiology
In Frontiers in Cell and Developmental Biology on 30 December 2022 by Khakurel, A., Kudlyk, T., et al.
Golgi-associated retrograde protein (GARP) is an evolutionary conserved heterotetrameric protein complex that tethers endosome-derived vesicles and is vital for Golgi glycosylation. Microscopy and proteomic approaches were employed to investigate defects in Golgi physiology in RPE1 cells depleted for the GARP complex. Both cis and trans-Golgi compartments were significantly enlarged in GARP-knock-out (KO) cells. Proteomic analysis of Golgi-enriched membranes revealed significant depletion of a subset of Golgi residents, including Ca2+ binding proteins, enzymes, and SNAREs. Validation of proteomics studies revealed that SDF4 and ATP2C1, related to Golgi calcium homeostasis, as well as intra-Golgi v-SNAREs GOSR1 and BET1L, were significantly depleted in GARP-KO cells. Finding that GARP-KO is more deleterious to Golgi physiology than deletion of GARP-sensitive v-SNAREs, prompted a detailed investigation of COPI trafficking machinery. We discovered that in GARP-KO cells COPI is significantly displaced from the Golgi and partially relocalized to the ER-Golgi intermediate compartment (ERGIC). Moreover, COPI accessory proteins GOLPH3, ARFGAP1, GBF1, and BIG1 are also relocated to off-Golgi compartments. We propose that the dysregulation of COPI machinery, along with the depletion of Golgi v-SNAREs and alteration of Golgi Ca2+ homeostasis, are the major driving factors for the depletion of Golgi resident proteins, structural alterations, and glycosylation defects in GARP deficient cells.
Copyright © 2022 Khakurel, Kudlyk, Pokrovskaya, D’Souza and Lupashin.
-
Cell Biology
In PLoS Pathogens on 1 October 2022 by Moghimi, S., Viktorova, E. G., et al.
As ultimate parasites, viruses depend on host factors for every step of their life cycle. On the other hand, cells evolved multiple mechanisms of detecting and interfering with viral replication. Yet, our understanding of the complex ensembles of pro- and anti-viral factors is very limited in virtually every virus-cell system. Here we investigated the proteins recruited to the replication organelles of poliovirus, a representative of the genus Enterovirus of the Picornaviridae family. We took advantage of a strict dependence of enterovirus replication on a host protein GBF1, and established a stable cell line expressing a truncated GBF1 fused to APEX2 peroxidase that effectively supported viral replication upon inhibition of the endogenous GBF1. This construct biotinylated multiple host and viral proteins on the replication organelles. Among the viral proteins, the polyprotein cleavage intermediates were overrepresented, suggesting that the GBF1 environment is linked to viral polyprotein processing. The proteomics characterization of biotinylated host proteins identified multiple proteins previously associated with enterovirus replication, as well as more than 200 new factors recruited to the replication organelles. RNA metabolism proteins, many of which normally localize in the nucleus, constituted the largest group, underscoring the massive release of nuclear factors into the cytoplasm of infected cells and their involvement in viral replication. Functional analysis of several newly identified proteins revealed both pro- and anti-viral factors, including a novel component of infection-induced stress granules. Depletion of these proteins similarly affected the replication of diverse enteroviruses indicating broad conservation of the replication mechanisms. Thus, our data significantly expand the knowledge of the composition of enterovirus replication organelles, provide new insights into viral replication, and offer a novel resource for identifying targets for anti-viral interventions.
Copyright: © 2022 Moghimi et al. This is an open access article distributed under the terms of the Creative Commons Attribution License, which permits unrestricted use, distribution, and reproduction in any medium, provided the original author and source are credited.
-
WB
-
Immunology and Microbiology
GARP complex controls Golgi physiology by stabilizing COPI machinery and Golgi v-SNAREs
Preprint on BioRxiv : the Preprint Server for Biology on 23 July 2022 by Khakurel, A., Kudlyk, T., et al.
GARP is an evolutionary conserved heterotetrameric protein complex that is thought to tether endosome-derived vesicles and promotes their fusion in the trans -Golgi network. We have previously discovered the GARP’s role in maintaining Golgi glycosylation machinery. To further investigate the importance of the GARP complex for Golgi physiology, we employed Airyscan superresolution and electron microscopy, as well as the unbiased quantitative proteomic analysis of Golgi in RPE1 cells. Both cis and trans -Golgi compartments were significantly enlarged in GARP deficient cells with pronounced alterations of TGN morphology. In GARP-KO cells, proteomic analysis revealed a depletion of a subset of Golgi resident proteins, including Ca 2+ binding proteins, glycosylation enzymes, and v-SNAREs. We validated proteomics studies and discovered that two Golgi-resident proteins SDF4 and ATP2C1, related to Golgi calcium homeostasis, as well as intra-Golgi v-SNAREs GOSR1 and BET1L, are significantly depleted in GARP-KO cells. To test if SNARE depletion is responsible for the Golgi defects in GARP deficient cells, we created and analyzed GOSR1 and BET1L KO cell lines. Since GARP-KO was more deleterious to the Golgi physiology than SNARE-KOs, we have investigated other components of intra-Golgi vesicular trafficking, particularly COPI vesicular coat and its accessory proteins. We found that COPI is partially relocalized to the ERGIC compartment in GARP-KO cells. Moreover, COPI accessory proteins GOLPH3, ARFGAP1, GBF1 were displaced from the membrane and BIG1 was relocated to endolysosomal compartment in GARP-KO cells. We propose that the dysregulation of COPI machinery along with degradation of intra-Golgi v-SNAREs and alteration of Golgi Ca 2+ homeostasis are the major driving factors for the instability of Golgi resident proteins and glycosylation defects in GARP deficient cells.
-
Cell Biology
-
Endocrinology and Physiology
Preprint on BioRxiv : the Preprint Server for Biology on 25 May 2022 by Moghimi, S., Viktorova, E., et al.
As ultimate parasites, viruses depend on host factors for every step of their life cycle. On the other hand, cells evolved multiple mechanisms of detecting and interfering with viral replication. Yet, our understanding of the complex ensembles of pro- and anti-viral factors is very limited in virtually every virus-cell system. Here we investigated the proteins recruited to the replication organelles of poliovirus, a representative of the genus Enterovirus of the Picornaviridae family. We took advantage of a strict dependence of enterovirus replication on a host protein GBF1, and established a stable cell line expressing a truncated GBF1 fused to APEX2 peroxidase that effectively supported viral replication upon inhibition of the endogenous GBF1. This construct biotinylated multiple host and viral proteins on the replication organelles. Among the viral proteins, the polyprotein cleavage intermediates were overrepresented, arguing that the GBF1 environment is linked to the viral polyprotein processing. The proteomics characterization of biotinylated host proteins identified those previously associated with the enterovirus replication, as well as more than 200 new factors recruited to the replication organelles. RNA metabolism proteins many of which normally localize in the nucleus constituted the largest group, underscoring the massive release of nuclear factors in the cytoplasm of infected cells and their involvement in the viral replication. Analysis of several newly identified proteins revealed both pro- and anti-viral factors, including a novel component of infection-induced stress granules. Depletion of these proteins similarly affected the replication of diverse enteroviruses indicating broad conservation of the replication mechanisms. Thus, our data significantly increase the knowledge about the organization of enterovirus replication organelles and may provide new targets for anti-viral interventions.
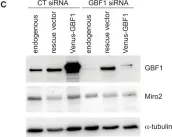
In PLoS Pathog on 1 October 2022 by Moghimi, S., Viktorova, E. G., et al.
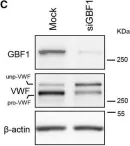
Fig.2.C

-
WB
-
Collected and cropped from PLoS Pathog by CiteAb, provided under a CC-BY license
Image 1 of 5
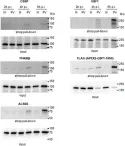
In Dev Cell on 3 June 2019 by Lopes-da-Silva, M., McCormack, J. J., et al.
Fig.2.C

-
WB
-
Collected and cropped from Dev Cell by CiteAb, provided under a CC-BY license
Image 1 of 5
In Dev Cell on 3 June 2019 by Lopes-da-Silva, M., McCormack, J. J., et al.
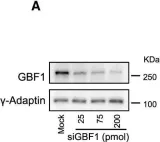
Fig.7.A

-
WB
-
Collected and cropped from Dev Cell by CiteAb, provided under a CC-BY license
Image 1 of 5
In Dev Cell on 3 June 2019 by Lopes-da-Silva, M., McCormack, J. J., et al.
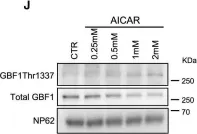
Fig.7.J

-
WB
-
Collected and cropped from Dev Cell by CiteAb, provided under a CC-BY license
Image 1 of 5
In Sci Rep on 20 November 2018 by Walch, L., Pellier, E., et al.
Fig.4.C

-
WB
-
Homo sapiens (Human)
Collected and cropped from Sci Rep by CiteAb, provided under a CC-BY license
Image 1 of 5