
Vacuolar protein sorting 41 (VPS41), a component of the homotypic fusion and protein sorting (HOPS) complex for lysosomal fusion, is essential for the trafficking of lysosomal membrane proteins via lysosome-associated membrane protein (LAMP) carriers from the trans-Golgi network (TGN) to endo/lysosomes. However, the molecular mechanisms underlying this pathway and VPS41's role herein remain poorly understood. Here, we investigated the effects of ectopically localizing VPS41 to mitochondria on LAMP distribution. Using electron microscopy, we identified that mitochondrial-localized VPS41 recruited LAMP1- and LAMP2A-positive vesicles resembling LAMP carriers. The retention using selective hooks (RUSH) system further revealed that newly synthesized LAMPs were specifically recruited by mitochondrial VPS41, a function not shared by other HOPS subunits. Notably, we identified the small GTPase Arl8b as a critical factor for LAMP carrier trafficking. Arl8b was present on LAMP carriers and bound to the WD40 domain of VPS41, enabling their recruitment. These findings reveal a unique role of VPS41 in recruiting TGN-derived LAMP carriers and expand our understanding of VPS41-Arl8b interactions beyond endosome-lysosome fusion, providing new insights into lysosomal trafficking mechanisms.
© 2025 Sanzà et al.
Product Citations: 164
VPS41 recruits biosynthetic LAMP-positive vesicles through interaction with Arl8b.
In The Journal of Cell Biology on 3 April 2025 by Sanzà, P., van der Beek, J., et al.
-
Cell Biology
Rapid turnover of CTLA4 is associated with a complex architecture of reversible ubiquitylation.
In The Journal of Cell Biology on 6 January 2025 by Tey, P. Y., Dufner, A., et al.
The immune checkpoint regulator CTLA4 is an unusually short-lived membrane protein. Here, we show that its lysosomal degradation is dependent on ubiquitylation at lysine residues 203 and 213. Inhibition of the v-ATPase partially restores CTLA4 levels following cycloheximide treatment, but also reveals a fraction that is secreted in exosomes. The endosomal deubiquitylase, USP8, interacts with CTLA4, and its loss enhances CTLA4 ubiquitylation in cancer cells, mouse CD4+ T cells, and cancer cell-derived exosomes. Depletion of the USP8 adapter protein, HD-PTP, but not ESCRT-0 recapitulates this cellular phenotype but shows distinct properties vis-à-vis exosome incorporation. Re-expression of wild-type USP8, but neither a catalytically inactive nor a localization-compromised ΔMIT domain mutant can rescue delayed degradation of CTLA4 or counteract its accumulation in clustered endosomes. UbiCRest analysis of CTLA4-associated ubiquitin chain linkages identifies a complex mixture of conventional Lys63- and more unusual Lys27- and Lys29-linked polyubiquitin chains that may underly the rapidity of protein turnover.
© 2024 Tey et al.
-
Cell Biology
Preprint on Research Square on 31 December 2024 by Palau, F., Cantarero, L., et al.
Abstract Pathogenic variants of GDAP1 cause Charcot-Marie-Tooth disease (CMT), an inherited neuropathy characterized by axonal degeneration. GDAP1, an atypical glutathione S-transferase, localizes to the outer mitochondrial membrane (OMM), regulating this organelle's dynamics, transport, and membrane contact sites (MCSs). It has been proposed that GDAP1 functions as a cellular redox sensor. However, its precise contribution to redox homeostasis remains poorly understood, as does the possible redox regulation at mitochondrial MCSs. Given the relationship between the peroxisomal redox state and overall cellular redox balance, we investigated the role of GDAP1 in peroxisomal function and mitochondrial MCSs maintenance by using high-resolution microscopy, live cell imaging with pH-sensitive fluorescent probes, and transcriptomic and lipidomic analyses in the Gdap1-/- mice and patient-derived fibroblasts. We demonstrate that GDAP1 deficiency disrupts mitochondria-peroxisome MCSs and leads to peroxisomal abnormalities, which are reversible upon pharmacological activation of PPARγ or glutathione supplementation. These results identify GDAP1 as a new tether of mitochondria-peroxisome MCSs that maintain peroxisomal number and integrity. The supply of glutathione (GSH-MEE) or GDAP1 overexpression suffices to rescue these MCSs. Furthermore, GDAP1 may regulate the redox state within the microdomain of mitochondrial MCSs, as suggested by decreased pH at mitochondria-lysosome contacts in patient-derived fibroblasts, highlighting the relationship between GDAP1 and redox-sensitive targets. Finally, in vivo analysis of sciatic nerve tissue in Gdap1-/- mice revealed significant axonal structural abnormalities, including nodes of Ranvier disruption and defects in the distribution and morphology of mitochondria, lysosomes, and peroxisomes, emphasizing the importance of GDAP1 in sustaining axon integrity in the peripheral nervous system. Taken together, this study positions GDAP1 as a multifunctional protein that mediates mitochondrial interaction with cellular organelles of diverse functions, contributes to redox state sensing, and helps maintain axonal homeostasis. In addition, we identify PPAR as a novel therapeutic target, based on knowledge of the underlying pathogenetic mechanisms.
Nup358 restricts ER-mitochondria connectivity by modulating mTORC2/Akt/GSK3β signalling.
In EMBO Reports on 1 October 2024 by Kalarikkal, M., Saikia, R., et al.
ER-mitochondria contact sites (ERMCSs) regulate processes, including calcium homoeostasis, energy metabolism and autophagy. Previously, it was shown that during growth factor signalling, mTORC2/Akt gets recruited to and stabilizes ERMCSs. Independent studies showed that GSK3β, a well-known Akt substrate, reduces ER-mitochondria connectivity by disrupting the VAPB-PTPIP51 tethering complex. However, the mechanisms that regulate ERMCSs are incompletely understood. Here we find that annulate lamellae (AL), relatively unexplored subdomains of ER enriched with a subset of nucleoporins, are present at ERMCSs. Depletion of Nup358, an AL-resident nucleoporin, results in enhanced mTORC2/Akt activation, GSK3β inhibition and increased ERMCSs. Depletion of Rictor, a mTORC2-specific subunit, or exogenous expression of GSK3β, was sufficient to reverse the ERMCS-phenotype in Nup358-deficient cells. We show that growth factor-mediated activation of mTORC2 requires the VAPB-PTPIP51 complex, whereas, Nup358's association with this tether restricts mTORC2/Akt signalling and ER-mitochondria connectivity. Expression of a Nup358 fragment that is sufficient for interaction with the VAPB-PTPIP51 complex suppresses mTORC2/Akt activation and disrupts ERMCSs. Collectively, our study uncovers a novel role for Nup358 in controlling ERMCSs by modulating the mTORC2/Akt/GSK3β axis.
© 2024. The Author(s).
-
Cell Biology
In Nature Communications on 26 September 2024 by Schiffelers, L. D., Tesfamariam, Y. M., et al.
Inflammasome activation results in the cleavage of gasdermin D (GSDMD) by pro-inflammatory caspases. The N-terminal domains (GSDMDNT) oligomerize and assemble pores penetrating the target membrane. As methods to study pore formation in living cells are insufficient, the order of conformational changes, oligomerization, and membrane insertion remained unclear. We have raised nanobodies (VHHs) against human GSDMD and find that cytosolic expression of VHHGSDMD-1 and VHHGSDMD-2 prevents oligomerization of GSDMDNT and pyroptosis. The nanobody-stabilized GSDMDNT monomers partition into the plasma membrane, suggesting that membrane insertion precedes oligomerization. Inhibition of GSDMD pore formation switches cell death from pyroptosis to apoptosis, likely driven by the enhanced caspase-1 activity required to activate caspase-3. Recombinant antagonistic nanobodies added to the extracellular space prevent pyroptosis and exhibit unexpected therapeutic potential. They may thus be suitable to treat the ever-growing list of diseases caused by activation of (non-) canonical inflammasomes.
© 2024. The Author(s).
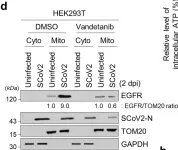
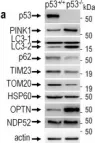
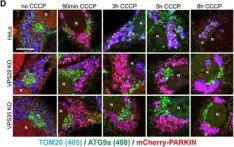
In Signal Transduct Target Ther on 11 May 2024 by Shin, H. J., Lee, W., et al.
Fig.3.D

-
WB
-
Collected and cropped from Signal Transduct Target Ther by CiteAb, provided under a CC-BY license
Image 1 of 42
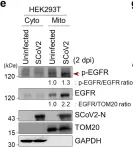
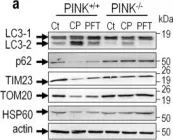
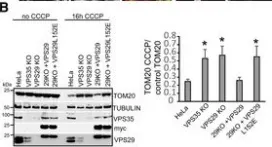
In Signal Transduct Target Ther on 11 May 2024 by Shin, H. J., Lee, W., et al.
Fig.2.E

-
WB
-
Collected and cropped from Signal Transduct Target Ther by CiteAb, provided under a CC-BY license
Image 1 of 42
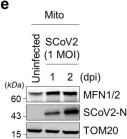
In Signal Transduct Target Ther on 11 May 2024 by Shin, H. J., Lee, W., et al.
Fig.1.E

-
WB
-
Collected and cropped from Signal Transduct Target Ther by CiteAb, provided under a CC-BY license
Image 1 of 42
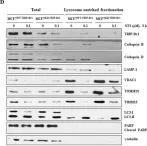
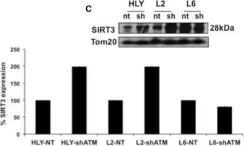
In Int J Biol Sci on 12 July 2022 by Jung, S., Myagmarjav, D., et al.
Fig.6.D

-
WB
-
Collected and cropped from Int J Biol Sci by CiteAb, provided under a CC-BY license
Image 1 of 42
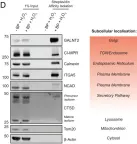
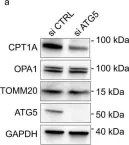
In Proc Natl Acad Sci U S A on 21 June 2022 by Simonetti, B., Daly, J. L., et al.
Fig.1.D

-
WB
-
Collected and cropped from Proc Natl Acad Sci U S A by CiteAb, provided under a CC-BY license
Image 1 of 42
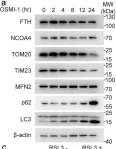
In Nat Commun on 19 May 2022 by Mece, O., Houbaert, D., et al.
Fig.5.A

-
WB
-
Collected and cropped from Nat Commun by CiteAb, provided under a CC-BY license
Image 1 of 42
In Cell Discov on 3 May 2022 by Yu, F., Zhang, Q., et al.
Fig.5.A

-
WB
-
Collected and cropped from Cell Discov by CiteAb, provided under a CC-BY license
Image 1 of 42
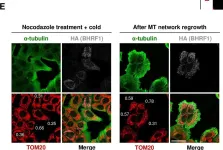
In PLoS Pathog on 1 March 2022 by Glon, D., Vilmen, G., et al.
Fig.1.E

-
ICC-IF
-
Collected and cropped from PLoS Pathog by CiteAb, provided under a CC-BY license
Image 1 of 42
In Nat Commun on 2 June 2021 by Della-Flora Nunes, G., Wilson, E. R., et al.
Fig.4.I

-
WB
-
Mus musculus (House mouse)
Collected and cropped from Nat Commun by CiteAb, provided under a CC-BY license
Image 1 of 42
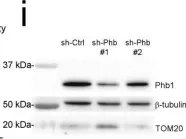
In Sci Rep on 3 December 2020 by Bhalla, K., Jaber, S., et al.
Fig.1.C

-
WB
-
Homo sapiens (Human)
Collected and cropped from Sci Rep by CiteAb, provided under a CC-BY license
Image 1 of 42
In Cancers (Basel) on 27 October 2020 by Valença, I., Ferreira, A. R., et al.
Fig.1.A

-
WB
-
Collected and cropped from Cancers (Basel) by CiteAb, provided under a CC-BY license
Image 1 of 42
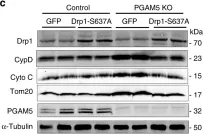
In Nat Commun on 21 May 2020 by Yu, B., Ma, J., et al.
Fig.6.C

-
WB
-
Collected and cropped from Nat Commun by CiteAb, provided under a CC-BY license
Image 1 of 42
In Sci Rep on 6 November 2019 by Santos, M., Morais, S., et al.
Fig.5.B

-
WB
-
Homo sapiens (Human)
Collected and cropped from Sci Rep by CiteAb, provided under a CC-BY license
Image 1 of 42
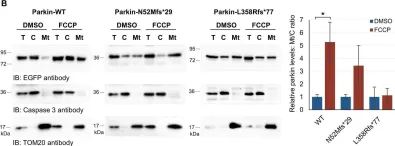
In Cell Death Differ on 1 May 2018 by Goiran, T., Duplan, E., et al.
Fig.6.A

-
WB
-
Homo sapiens (Human)
Collected and cropped from Cell Death Differ by CiteAb, provided under a CC-BY license
Image 1 of 42
In Cell Death Differ on 1 May 2018 by Goiran, T., Duplan, E., et al.
Fig.8.A

-
WB
-
Collected and cropped from Cell Death Differ by CiteAb, provided under a CC-BY license
Image 1 of 42
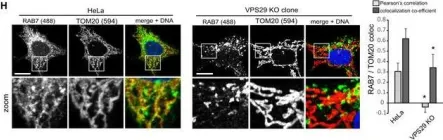
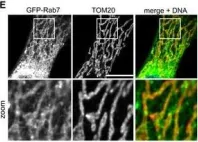
In EMBO J on 17 January 2018 by Jimenez-Orgaz, A., Kvainickas, A., et al.
Fig.1.H

-
IF
-
Homo sapiens (Human)
Collected and cropped from EMBO J by CiteAb, provided under a CC-BY license
Image 1 of 42
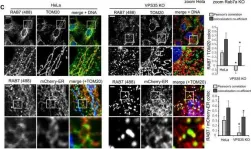
In EMBO J on 17 January 2018 by Jimenez-Orgaz, A., Kvainickas, A., et al.
Fig.1.C

-
IF
-
Homo sapiens (Human)
Collected and cropped from EMBO J by CiteAb, provided under a CC-BY license
Image 1 of 42
In EMBO J on 17 January 2018 by Jimenez-Orgaz, A., Kvainickas, A., et al.
Fig.1.E

-
IF
-
Homo sapiens (Human)
Collected and cropped from EMBO J by CiteAb, provided under a CC-BY license
Image 1 of 42
In EMBO J on 17 January 2018 by Jimenez-Orgaz, A., Kvainickas, A., et al.
Fig.8.B

-
IF
-
Homo sapiens (Human)
Collected and cropped from EMBO J by CiteAb, provided under a CC-BY license
Image 1 of 42
In EMBO J on 17 January 2018 by Jimenez-Orgaz, A., Kvainickas, A., et al.
Fig.8.A

-
IF
-
Homo sapiens (Human)
Collected and cropped from EMBO J by CiteAb, provided under a CC-BY license
Image 1 of 42
In EMBO J on 17 January 2018 by Jimenez-Orgaz, A., Kvainickas, A., et al.
Fig.9.C

-
IF
-
Homo sapiens (Human)
Collected and cropped from EMBO J by CiteAb, provided under a CC-BY license
Image 1 of 42
In EMBO J on 17 January 2018 by Jimenez-Orgaz, A., Kvainickas, A., et al.
Fig.7.D

-
IF
-
Homo sapiens (Human)
Collected and cropped from EMBO J by CiteAb, provided under a CC-BY license
Image 1 of 42
In EMBO J on 17 January 2018 by Jimenez-Orgaz, A., Kvainickas, A., et al.
Fig.6.B

-
WB
-
Homo sapiens (Human)
Collected and cropped from EMBO J by CiteAb, provided under a CC-BY license
Image 1 of 42
In EMBO J on 17 January 2018 by Jimenez-Orgaz, A., Kvainickas, A., et al.
Fig.2.D

-
IF
-
Homo sapiens (Human)
Collected and cropped from EMBO J by CiteAb, provided under a CC-BY license
Image 1 of 42
In EMBO J on 17 January 2018 by Jimenez-Orgaz, A., Kvainickas, A., et al.
Fig.2.C

-
IF
-
Homo sapiens (Human)
Collected and cropped from EMBO J by CiteAb, provided under a CC-BY license
Image 1 of 42