ABSTRACT Many transmembrane (TM) receptors undergo essential post-translational modification in the Golgi prior to their delivery to the plasma membrane. Whether and how the passage and accompanied modification of these receptors across the Golgi is controlled remains unclear. Here, we show that leptin receptor overlapping transcript (LEPROT) and LEPROT-like 1 (LEPROTL1) regulate receptor activation by securing their sufficient Golgi retention. LEPROTs localize to cis and medial Golgi in a COPI-dependent manner. Deletion of LEPROTs in cells causes expedited release of receptors transiting through the Golgi, and leakage of some Golgi-enriched proteins into the endomembrane compartments. LEPROTs interact directly with COPI coats and simultaneously engage a variety of integral membrane proteins with relatively long TM domains at acidic pH. Loss of LEPROTs dysregulates receptor activity, including that of EGFR and TFRC, due to defective modification. Collectively, LEPROTs serve as a class of COPI adaptors for TM receptors, ensuring adequate preparation, which is vital for subsequent action on the plasma membrane.
Product Citations: 23
Preprint on BioRxiv : the Preprint Server for Biology on 14 April 2025 by Gao, J., Cong, C., et al.
-
Cell Biology
In Molecular Neurobiology on 1 December 2024 by Sultana, J., Ragagnin, A. M. G., et al.
Hexanucleotide repeat expansions (HREs) in the chromosome 9 open reading frame 72 (C9orf72) gene are the most frequent genetic cause of amyotrophic lateral sclerosis (ALS) and frontotemporal dementia (FTD). Both are debilitating neurodegenerative conditions affecting either motor neurons (ALS) in the brain and spinal cord or neurons in the frontal and/or temporal cortical lobes (FTD). HREs undergo repeat-associated non-ATG (RAN) translation on both sense and anti-sense strands, generating five distinct dipeptide repeat proteins (DPRs), poly-GA, -GR, -GP, -PA and -PR. Perturbed proteostasis is well-recognised in ALS pathogenesis, including processes affecting the endoplasmic reticulum (ER) and Golgi compartments. However, these mechanisms have not been well characterised for C9orf72-mediated ALS/FTD. In this study we demonstrate that C9orf72 DPRs polyGA, polyGR and polyGP (× 40 repeats) disrupt secretory protein transport from the ER to the Golgi apparatus in neuronal cells. Consistent with this finding, these DPRs also induce fragmentation of the Golgi apparatus, activate ER stress, and inhibit the formation of the omegasome, the precursor of the autophagosome that originates from ER membranes. We also demonstrate Golgi fragmentation in cells undergoing RAN translation that express polyGP. Furthermore, dysregulated ER-Golgi transport was confirmed in C9orf72 patient dermal fibroblasts. Evidence of aberrant ER-derived vesicles in spinal cord motor neurons from C9orf72 ALS patients compared to controls was also obtained. These data thus confirm that ER proteostasis and ER-Golgi transport is perturbed in C9orf72-ALS in the absence of protein over-expression. Hence this study identifies novel molecular mechanisms associated with the ER and Golgi compartments induced by the C9orf72 HRE.
© 2024. The Author(s).
-
ICC
-
Homo sapiens (Human)
-
Cell Biology
TFG regulates inner COPII coat recruitment to facilitate anterograde secretory protein transport.
In Molecular Biology of the Cell on 1 August 2024 by Kasberg, W., Luong, P., et al.
Coat protein complex II (COPII) governs the initial steps of biosynthetic secretory protein transport from the endoplasmic reticulum (ER), facilitating the movement of a wide variety of cargoes. Here, we demonstrate that Trk-fused gene (TFG) regulates the rate at which inner COPII coat proteins are concentrated at ER subdomains. Specifically, in cells lacking TFG, the GTPase-activating protein (GAP) Sec23 accumulates more rapidly at budding sites on the ER as compared with control cells, potentially altering the normal timing of GTP hydrolysis on Sar1. Under these conditions, anterograde trafficking of several secretory cargoes is delayed, irrespective of their predicted size. We propose that TFG controls the local, freely available pool of Sec23 during COPII coat formation and limits its capacity to prematurely destabilize COPII complexes on the ER. This function of TFG enables it to act akin to a rheostat, promoting the ordered recruitment of Sec23, which is critical for efficient secretory cargo export.
-
ICC-IF
-
Homo sapiens (Human)
-
Cell Biology
A dual role of ERGIC-localized Rabs in TMED10-mediated unconventional protein secretion.
In Nature Cell Biology on 1 July 2024 by Sun, Y., Tao, X., et al.
Cargo translocation across membranes is a crucial aspect of secretion. In conventional secretion signal peptide-equipped proteins enter the endoplasmic reticulum (ER), whereas a subset of cargo lacking signal peptides translocate into the ER-Golgi intermediate compartment (ERGIC) in a process called unconventional protein secretion (UcPS). The regulatory events at the ERGIC in UcPS are unclear. Here we reveal the involvement of ERGIC-localized small GTPases, Rab1 (Rab1A and Rab1B) and Rab2A, in regulating UcPS cargo transport via TMED10 on the ERGIC. Rab1 enhances TMED10 translocator activity, promoting cargo translocation into the ERGIC, whereas Rab2A, in collaboration with KIF5B, regulates ERGIC compartmentalization, establishing a UcPS-specific compartment. This study highlights the pivotal role of ERGIC-localized Rabs in governing cargo translocation and specifying the ERGIC's function in UcPS.
© 2024. The Author(s), under exclusive licence to Springer Nature Limited.
-
Cell Biology
In Nature Communications on 8 December 2023 by Kasberg, W., Luong, P., et al.
Co-assembly of the multilayered coat protein complex II (COPII) with the Sar1 GTPase at subdomains of the endoplasmic reticulum (ER) enables secretory cargoes to be concentrated efficiently within nascent transport intermediates, which subsequently deliver their contents to ER-Golgi intermediate compartments. Here, we define the spatiotemporal accumulation of native COPII subunits and secretory cargoes at ER subdomains under differing nutrient availability conditions using a combination of CRISPR/Cas9-mediated genome editing and live cell imaging. Our findings demonstrate that the rate of inner COPII coat recruitment serves as a determinant for the pace of cargo export, irrespective of COPII subunit expression levels. Moreover, increasing inner COPII coat recruitment kinetics is sufficient to rescue cargo trafficking deficits caused by acute nutrient limitation. Our findings are consistent with a model in which the rate of inner COPII coat addition acts as an important control point to regulate cargo export from the ER.
© 2023. The Author(s).
-
Homo sapiens (Human)
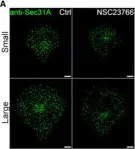
In EMBO J on 15 September 2022 by Phuyal, S., Djaerff, E., et al.
Fig.1.A

-
ICC-IF
-
Collected and cropped from EMBO J by CiteAb, provided under a CC-BY license
Image 1 of 2
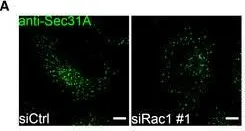
In EMBO J on 15 September 2022 by Phuyal, S., Djaerff, E., et al.
Fig.3.A

-
ICC-IF
-
Collected and cropped from EMBO J by CiteAb, provided under a CC-BY license
Image 1 of 2