IL-2, a central regulator of immune function, binds to its receptor subunit CD25 (IL-2Rα), promoting IL-2 interaction with β and γ subunits to trigger the canonical IL-2 signaling pathway. An anti-mouse CD25 antibody, PC61, triggers alternative IL-2 signaling, leading to integrin activation. PC61 induces a complex formed by the IL-2-dependent association of CD25 with CCR7, suggesting that the formation of this complex initiates alternative IL-2 signaling. Here, we used structure-based design together with combinatorial screening to identify an IL-2 mutant (denoted IL-2(E52K)) that spares canonical IL-2 signaling but disrupts both PC61-induced complex formation and integrin activation while retaining the full CD25 affinity of the parent molecule. We also report that heparan sulfate (HS), a physiological ligand of IL-2 that triggers alternative signaling, induced IL-2-dependent CD25-CCR7 association, whereas IL-2(E52K) failed to support both HS-induced CD25-CCR7 complex formation and integrin activation. Thus, both anti-CD25 antibody and HS require common features of IL-2 needed for CD25-CCR7 complex assembly and resulting integrin activation. Collectively, these data show that IL-2 promotes CD25 interaction with CCR7, thereby forming the signal initiating complex. Furthermore, canonical and alternative IL-2 signaling can be decoupled by an IL-2 mutation, creating a tool to specify the biological role of alternative IL-2 signaling in immune responses.
Product Citations: 86
A CD25-CCR7 complex initiates non-canonical IL-2 signaling
Preprint on BioRxiv : the Preprint Server for Biology on 4 February 2025 by Kim, S. H. J., Lee, H., et al.
Stroma-derived Dickkopf-1 contributes to the suppression of NK cell cytotoxicity in breast cancer.
In Nature Communications on 30 January 2025 by Lee, S., Ricci, B., et al.
Mechanisms related to tumor evasion from NK cell-mediated immune surveillance remain enigmatic. Dickkopf-1 (DKK1) is a Wnt/β-catenin inhibitor, whose levels correlate with breast cancer progression. We find DKK1 to be expressed by tumor cells and cancer-associated fibroblasts (CAFs) in patient samples and orthotopic breast tumors, and in bone. By using genetic approaches, we find that bone-derived DKK1 contributes to the systemic DKK1 elevation in tumor-bearing female mice, while CAFs contribute to DKK1 at primary tumor site. Systemic and bone-specific DKK1 targeting reduce tumor growth. Intriguingly, deletion of CAF-derived DKK1 also limits breast cancer progression, without affecting its levels in circulation, and regardless of DKK1 expression in the tumor cells. While not directly supporting tumor proliferation, stromal-DKK1 suppresses NK cell activation and cytotoxicity by downregulating AKT/ERK/S6 phosphorylation. Importantly, increased DKK1 levels and reduced cytotoxic NK cells are detected in women with progressive breast cancer. Our findings indicate that DKK1 represents a barrier to anti-tumor immunity through suppression of NK cells.
© 2025. The Author(s).
-
Cancer Research
Metabolic programs drive function of therapeutic NK cells in hypoxic tumor environments.
In Science Advances on 1 November 2024 by Kennedy, P. R., Arvindam, U. S., et al.
Limited oxygen (hypoxia) in solid tumors poses a challenge to successful immunotherapy with natural killer (NK) cells. NK cells have impaired cytotoxicity when cultured in hypoxia (1% oxygen) but not physiologic (>5%) or atmospheric oxygen (20%). We found that changes to cytotoxicity were regulated at the transcriptional level and accompanied by metabolic dysregulation. Dosing with interleukin-15 (IL-15) enhanced NK cell cytotoxicity in hypoxia, but preactivation with feeder cells bearing IL-21 and 4-1BBL was even better. Preactivation resulted in less perturbed metabolism in hypoxia; greater resistance to oxidative stress; and no hypoxia-induced loss of transcription factors (T-bet and Eomes), activating receptors, adhesion molecules (CD2), and cytotoxic proteins (TRAIL and FasL). There remained a deficit in CD122/IL-2Rβ when exposed to hypoxia, which affected IL-15 signaling. However, tri-specific killer engager molecules that deliver IL-15 in the context of anti-CD16/FcγRIII were able to bypass this deficit, enhancing cytotoxicity of both fresh and preactivated NK cells in hypoxia.
-
Biochemistry and Molecular biology
-
Cancer Research
-
Cell Biology
In Cell Reports Medicine on 15 October 2024 by Wu, J., Bloch, N., et al.
The clinical use of interleukin-2 (IL-2) for cancer immunotherapy is limited by severe toxicity. Emerging IL-2 therapies with reduced IL-2 receptor alpha (IL-2Rα) binding aim to mitigate toxicity and regulatory T cell (Treg) expansion but have had limited clinical success. Here, we show that IL-2Rα engagement is critical for the anti-tumor activity of systemic IL-2 therapy. A "non-α" IL-2 mutein induces systemic expansion of CD8+ T cells and natural killer (NK) cells over Tregs but exhibits limited anti-tumor efficacy. We develop a programmed cell death protein 1 (PD-1)-targeted, receptor-masked IL-2 immunocytokine, PD1-IL2Ra-IL2, which attenuates systemic IL-2 activity while maintaining the capacity to engage IL-2Rα on PD-1+ T cells. Mice treated with PD1-IL2Ra-IL2 show no systemic toxicities observed with unmasked IL-2 treatment yet achieve robust tumor growth control. Furthermore, PD1-IL2Ra-IL2 can be effectively combined with other T cell-mediated immunotherapies to enhance anti-tumor responses. These findings highlight the therapeutic potential of PD1-IL2Ra-IL2 as a targeted, receptor-masked, and "α-maintained" IL-2 therapy for cancer.
Copyright © 2024 The Author(s). Published by Elsevier Inc. All rights reserved.
-
Cancer Research
-
Immunology and Microbiology
In Nature Communications on 27 August 2024 by Lin, J. X., Ge, M., et al.
Cytokine-mediated STAT5 protein activation is vital for lymphocyte development and function. In vitro tyrosine phosphorylation of a C-terminal tyrosine is critical for activation of STAT5A and STAT5B; however, the importance of STAT5 tyrosine phosphorylation in vivo has not been assessed. Here we generate Stat5a and Stat5b tyrosine-to-phenylalanine mutant knockin mice and find they have greatly reduced CD8+ T-cell numbers and profoundly diminished IL-2-induced proliferation of these cells, and this correlates with reduced induction of Myc, pRB, a range of cyclins and CDKs, and a partial G1→S phase-transition block. These mutant CD8+ T cells also exhibit decreased IL-2-mediated activation of pERK and pAKT, which we attribute in part to diminished expression of IL-2Rβ and IL-2Rγ. Our findings thus demonstrate that tyrosine phosphorylation of both STAT5A and STAT5B is essential for maximal IL-2 signaling. Moreover, our transcriptomic and proteomic analyses elucidate the molecular basis of the IL-2-induced proliferation of CD8+ T cells.
© 2024. This is a U.S. Government work and not under copyright protection in the US; foreign copyright protection may apply.
-
Immunology and Microbiology
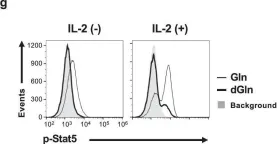
In Commun Biol on 24 July 2020 by Toriyama, K., Kuwahara, M., et al.
Fig.7.G

-
FC/FACS
-
Collected and cropped from Commun Biol by CiteAb, provided under a CC-BY license
Image 1 of 8
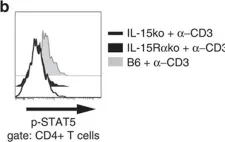
In Nat Commun on 11 March 2016 by Tosiek, M. J., Fiette, L., et al.
Fig.7.B

-
FC/FACS
-
Mus musculus (House mouse)
Collected and cropped from Nat Commun by CiteAb, provided under a CC-BY license
Image 1 of 8
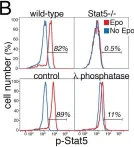
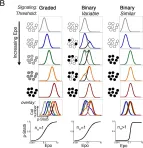
In PLoS Biol on 1 August 2012 by Porpiglia, E., Hidalgo, D., et al.
Fig.1.B

-
FC/FACS
-
Mus musculus (House mouse)
Collected and cropped from PLoS Biol by CiteAb, provided under a CC-BY license
Image 1 of 8
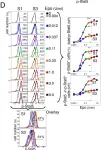
In PLoS Biol on 1 August 2012 by Porpiglia, E., Hidalgo, D., et al.
Fig.1.D

-
FC/FACS
-
Mus musculus (House mouse)
Collected and cropped from PLoS Biol by CiteAb, provided under a CC-BY license
Image 1 of 8
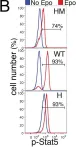
In PLoS Biol on 1 August 2012 by Porpiglia, E., Hidalgo, D., et al.
Fig.2.B

-
FC/FACS
-
Mus musculus (House mouse)
Collected and cropped from PLoS Biol by CiteAb, provided under a CC-BY license
Image 1 of 8
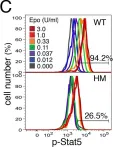
In PLoS Biol on 1 August 2012 by Porpiglia, E., Hidalgo, D., et al.
Fig.3.B

-
FC/FACS
-
Mus musculus (House mouse)
Collected and cropped from PLoS Biol by CiteAb, provided under a CC-BY license
Image 1 of 8
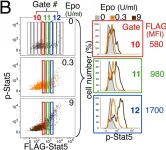
In PLoS Biol on 1 August 2012 by Porpiglia, E., Hidalgo, D., et al.
Fig.3.C

-
FC/FACS
-
Mus musculus (House mouse)
Collected and cropped from PLoS Biol by CiteAb, provided under a CC-BY license
Image 1 of 8
In PLoS Biol on 1 August 2012 by Porpiglia, E., Hidalgo, D., et al.
Fig.5.B

-
FC/FACS
-
Mus musculus (House mouse)
Collected and cropped from PLoS Biol by CiteAb, provided under a CC-BY license
Image 1 of 8