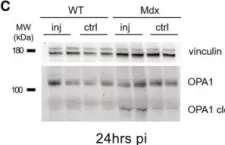
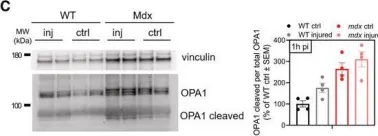
The emergence of neuropathic pain is significantly influenced by the impairment of mitochondrial processes. Ensuring the stability of mitochondrial activity requires a delicate equilibrium between the processes of mitochondrial fission and fusion. However, the specific alterations in mitochondrial activity across different models of neuropathic pain and the underlying mechanisms remain largely unclear. We developed a persistent compression injury (CCI) model targeting the sciatic nerve in mice. CCI induced pain like behaviors in mice, which were associated with increased levels of dynamin related protein 1 (Drp1) and decreased expression of the fusion protein OPA1 and an increase in the percentage of DRG nerve cell mitochondria in the fission form, and a decrease in percentage in the fusion form. Ultrastructural analysis showed that mitochondria in CCI mice were smaller in perimeter and area, adopting a more circular shape. Overexpression of OPA1 mediated by AAV attenuated pain hypersensitivity, lowered oxidative stress, and expanded mitochondrial circumference and area. Mdivi-1 treatment reduced pain, whereas blocking fusion with MYLS22 augmented pain and oxidative stress and further led to increased mitochondrial fragmentation. Our results illustrate that Mitochondria in DRG nerve cell are highly sensitive to neuropathic pain. Modulating mitochondrial fission and fusion through targeted gene overexpression and pharmacological inhibitors restores mitochondrial dynamics, reduces oxidative stress, and alleviates neuropathic pain in mice. These findings position mitochondrial dynamics as promising therapeutic targets for pain management.
© 2025. The Author(s).
Product Citations: 351
In Scientific Reports on 4 May 2025 by Xie, L., Cao, J., et al.
-
Cell Biology
Human RCC1L is involved in the maintenance of mitochondrial nucleoids and mtDNA.
In Scientific Reports on 21 April 2025 by Matsumoto, E., Sasaki, T., et al.
Mitochondrial DNA (mtDNA) is organized with proteins into mitochondrial nucleoid (mt-nucleoid). The mt-nucleoid is a unit for the maintenance and function of mtDNA. The regulator of chromosome condensation 1-like protein (RCC1L) performs various functions in mitochondria, including translation, but its involvement in regulating mt-nucleoid maintenance is unknown. Herein, we found that human RCC1L was required to maintain mt-nucleoids and mtDNA. Human RCC1L has three splicing isoforms: RCC1LV1, RCC1LV2, and RCC1LV3. Knockout (KO) cells lacking all RCC1L isoforms, which were lethal without pyruvate and uridine, exhibited a decrease in mt-nucleoids and mtDNA, along with swollen and fragmented mitochondria. Among the three RCC1L isoforms, only RCC1LV1 recovered all phenotypes observed in RCC1L KO cells. As the treatment of wild-type cells with chloramphenicol, a mitochondrial translation inhibitor, did not lead to the decrease in mt-nucleoids accompanied by mtDNA depletion, the decrease in mt-nucleoids and mtDNA in RCC1L KO cells was not solely attributed to impaired mitochondrial translation. Using conditional RCC1L KO cells, we observed a rapid decrease in mt-nucleoids and mtDNA during a specific period following RCC1L loss. Our findings indicate that RCC1L regulates the maintenance of mt-nucleoids and mtDNA besides its role in mitochondrial translational regulation.
© 2025. The Author(s).
-
WB
-
Homo sapiens (Human)
-
Cell Biology
Preprint on BioRxiv : the Preprint Server for Biology on 20 April 2025 by Koo, K., Choi, J., et al.
SUMMARY Mitochondrial function is critical for neural progenitor regulation, yet its dysregulation during early human brain development remains poorly defined. Megalencephalic leukoencephalopathy with subcortical cysts (MLC) is a neurodevelopmental disorder caused by MLC1 mutations, previously attributed to postnatal astrocyte dysfunction. Using patient-derived human cortical organoids, we show that MLC1 is expressed in early neuroepithelial cells. To assess mitochondrial state in live organoids, we developed the MAGO (Matrigel-coated gold nanostructure) platform for real-time, label-free detection of redox activity. MLC1 mutant organoids showed mitochondrial hyperactivation, increased ATP and ROS, reduced membrane potential, and altered fusion protein expression. These changes were accompanied by enhanced BrdU incorporation and expansion of PAX6⁺/SOX2⁺ progenitors. To assess the causal role of MLC1 mutation, we generated isogenic organoids using CRISPR prime editing, which recapitulated redox hyperactivation and increased proliferation. Our findings redefine MLC as a disorder of early mitochondrial and progenitor dysregulation and establish a tractable platform to study metabolic mechanisms in neurodevelopmental disease.
-
Biochemistry and Molecular biology
-
Cell Biology
In Science Advances on 11 April 2025 by McKenna, M. J., Kraus, F., et al.
Maintaining an optimal mitochondrial distribution is critical to ensure an adequate supply of energy and metabolites to support important cellular functions. How cells balance dynamic mitochondrial processes to achieve homeostasis is incompletely understood. Here, we show that ARMC1 partitioning between distinct mitochondrial protein complexes is a key determinant of mitochondrial distribution. In one complex, the mitochondrial trafficking adaptor MIRO recruits ARMC1, which mediates the assembly of a mitochondrial fission regulator (MTFR). MTFR stability depends on ARMC1, and MIRO-MTFR complexes specifically antagonize retrograde mitochondrial movement. In another complex, DNAJC11 facilitates ARMC1 release from mitochondria. Disrupting MIRO-MTFR assembly fails to rescue aberrant mitochondrial distributions clustered in the perinuclear area observed with ARMC1 deletion, while disrupting ARMC1 interaction with DNAJC11 leads to excessive mitochondrially localized ARMC1 and distinct mitochondrial defects. Thus, the abundance and trafficking impact of MIRO-MTFR complexes require ARMC1, whose mito-cytoplasmic shuttling balanced by DNAJC11 tunes steady-state mitochondrial distributions.
-
Cell Biology
Dependence of mitochondrial calcium signalling and dynamics on the disaggregase, CLPB.
In Nature Communications on 21 March 2025 by D'Angelo, D., Sánchez-Vázquez, V. H., et al.
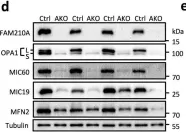
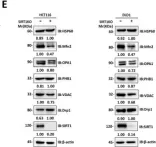
Cells utilize protein disaggregases to avoid abnormal protein aggregation that causes many diseases. Among these, caseinolytic peptidase B protein homolog (CLPB) is localized in the mitochondrial intermembrane space and linked to human disease. Upon CLPB loss, MICU1 and MICU2, regulators of the mitochondrial calcium uniporter complex (mtCU), and OPA1, a main mediator of mitochondrial fusion, become insoluble but the functional outcome remains unclear. In this work we demonstrate that CLPB is required to maintain mitochondrial calcium signalling and fusion dynamics. CLPB loss results in altered mtCU composition, interfering with mitochondrial calcium uptake independently of cytosolic calcium and mitochondrial membrane potential. Additionally, OPA1 decreases, and aggregation occurs, accompanied by mitochondrial fragmentation. Disease-associated mutations in the CLPB gene present in skin fibroblasts from patients also display mitochondrial calcium and structural changes. Thus, mtCU and fusion activity are dependent on CLPB, and their impairments might contribute to the disease caused by CLPB variants.
© 2025. The Author(s).
-
Cell Biology
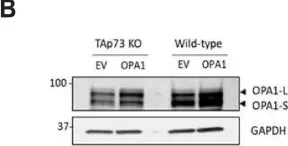
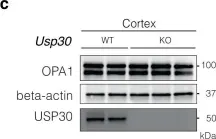
In Cell Death Dis on 8 November 2024 by Buckley, N., Craxton, A., et al.
Fig.2.B

-
WB
-
Collected and cropped from Cell Death Dis by CiteAb, provided under a CC-BY license
Image 1 of 83
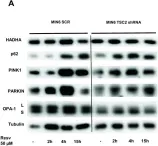
In Sci Rep on 31 May 2024 by Marques, P., Burillo, J., et al.
Fig.3.A

-
WB
-
Collected and cropped from Sci Rep by CiteAb, provided under a CC-BY license
Image 1 of 83
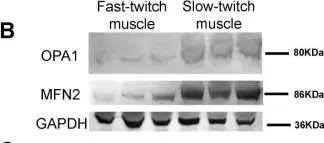
In Int J Mol Sci on 26 January 2024 by Li, B., Wang, H., et al.
Fig.5.B

-
WB
-
Collected and cropped from Int J Mol Sci by CiteAb, provided under a CC-BY license
Image 1 of 83
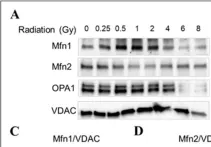
In Cells on 23 December 2023 by Wang, L., Rivas, R., et al.
Fig.7.A

-
WB
-
Homo sapiens (Human)
Collected and cropped from Cells by CiteAb, provided under a CC-BY license
Image 1 of 83
In Nat Commun on 13 November 2023 by Fang, T. Z., Sun, Y., et al.
Fig.1.C

-
WB
-
Collected and cropped from Nat Commun by CiteAb, provided under a CC-BY license
Image 1 of 83
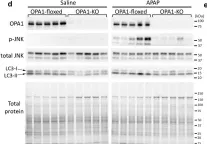
In Nat Commun on 23 October 2023 by Lee, H., Lee, T. J., et al.
Fig.7.D

-
WB
-
Mus musculus (House mouse)
Collected and cropped from Nat Commun by CiteAb, provided under a CC-BY license
Image 1 of 83
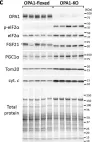
In Nat Commun on 23 October 2023 by Lee, H., Lee, T. J., et al.
Fig.4.C

-
WB
-
Mus musculus (House mouse)
Collected and cropped from Nat Commun by CiteAb, provided under a CC-BY license
Image 1 of 83
In Genes (Basel) on 20 October 2023 by Yang, C., Yang, X., et al.
Fig.4.D

-
WB
-
Collected and cropped from Genes (Basel) by CiteAb, provided under a CC-BY license
Image 1 of 83
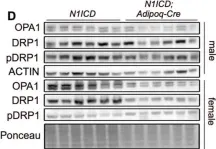
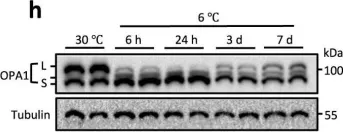
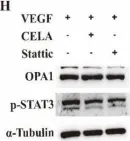
In Nat Commun on 10 October 2023 by Qiu, J., Yue, F., et al.
Fig.1.H

-
WB
-
Mus musculus (House mouse)
Collected and cropped from Nat Commun by CiteAb, provided under a CC-BY license
Image 1 of 83
In Nat Commun on 10 October 2023 by Qiu, J., Yue, F., et al.
Fig.6.D

-
WB
-
Mus musculus (House mouse)
Collected and cropped from Nat Commun by CiteAb, provided under a CC-BY license
Image 1 of 83
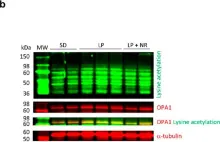
In EMBO J on 15 May 2023 by Acin-Perez, R., Zanette, V., et al.
Fig.6.C

-
WB
-
Collected and cropped from EMBO J by CiteAb, provided under a CC-BY license
Image 1 of 83
In EMBO J on 15 May 2023 by Acin-Perez, R., Zanette, V., et al.
Fig.5.C

-
WB
-
Collected and cropped from EMBO J by CiteAb, provided under a CC-BY license
Image 1 of 83
In Int J Biol Sci on 18 April 2023 by Wei, Z., Xia, J., et al.
Fig.6.E

-
WB
-
Collected and cropped from Int J Biol Sci by CiteAb, provided under a CC-BY license
Image 1 of 83
In Elife on 1 February 2023 by Mann, J. P., Duan, X., et al.
Fig.4.A

-
WB
-
Collected and cropped from Elife by CiteAb, provided under a CC-BY license
Image 1 of 83
In Elife on 1 February 2023 by Mann, J. P., Duan, X., et al.
Fig.4.B

-
WB
-
Collected and cropped from Elife by CiteAb, provided under a CC-BY license
Image 1 of 83
In Pharmaceutics on 23 December 2022 by Li, G., Zhou, L., et al.
Fig.3.C

-
WB
-
Collected and cropped from Pharmaceutics by CiteAb, provided under a CC-BY license
Image 1 of 83
In Pharmaceutics on 23 December 2022 by Li, G., Zhou, L., et al.
Fig.5.H

-
WB
-
Collected and cropped from Pharmaceutics by CiteAb, provided under a CC-BY license
Image 1 of 83
In Cells on 21 October 2022 by Pezzotta, A., Perico, L., et al.
Fig.4.B

-
WB
-
Collected and cropped from Cells by CiteAb, provided under a CC-BY license
Image 1 of 83
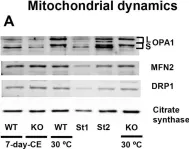
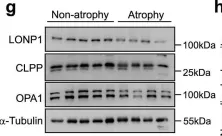
In Nutrients on 21 September 2022 by Lee, Y. G., Song, M. Y., et al.
Fig.4.D

-
WB
-
Collected and cropped from Nutrients by CiteAb, provided under a CC-BY license
Image 1 of 83
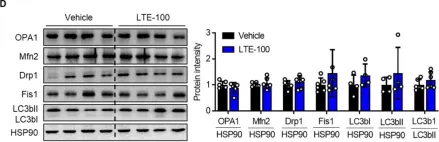
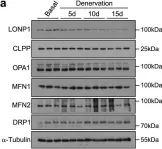
In Dis Model Mech on 1 April 2022 by Funda, J., Villena, J. A., et al.
Fig.4.A

-
WB
-
Collected and cropped from Dis Model Mech by CiteAb, provided under a CC-BY license
Image 1 of 83
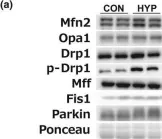
In Physiol Rep on 1 April 2022 by Nakano, D. & Machida, S.
Fig.2.A

-
WB
-
Rattus norvegicus (Rat)
Collected and cropped from Physiol Rep by CiteAb, provided under a CC-BY license
Image 1 of 83
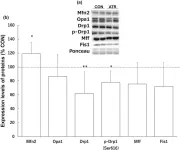
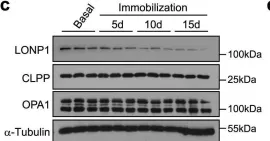
In Physiol Rep on 1 April 2022 by Nakano, D. & Machida, S.
Fig.5.A

-
WB
-
Rattus norvegicus (Rat)
Collected and cropped from Physiol Rep by CiteAb, provided under a CC-BY license
Image 1 of 83
In Nat Commun on 16 February 2022 by Xu, Z., Fu, T., et al.
Fig.1.G

-
WB
-
Collected and cropped from Nat Commun by CiteAb, provided under a CC-BY license
Image 1 of 83
In Nat Commun on 16 February 2022 by Xu, Z., Fu, T., et al.
Fig.1.A

-
WB
-
Collected and cropped from Nat Commun by CiteAb, provided under a CC-BY license
Image 1 of 83
In Nat Commun on 16 February 2022 by Xu, Z., Fu, T., et al.
Fig.1.C

-
WB
-
Collected and cropped from Nat Commun by CiteAb, provided under a CC-BY license
Image 1 of 83