Cells need to overcome both intrinsic and extrinsic threats. Although pluripotency is associated with damage responses, how stem cells respond to DNA damage remains controversial. Here, we elucidate that DNA damage activates Chk2, leading to the phosphorylation of serine 164 on C-terminal binding protein 2 (Ctbp2). The phosphorylation of Ctbp2 induces the disruption of Ctbp2 tetramer, weakening interactions with zinc finger proteins, leading to the dissociation of phosphorylated Ctbp2 from chromatin. This transition to a monomeric state results in the separation of histone deacetylase 1 from Ctbp2, consequently slowing the rate of H3K27 deacetylation. In contrast to the nucleosome remodeling and deacetylase complex, phosphorylated Ctbp2 increased binding affinity to polycomb repressive complex (PRC)2, interacting through the N-terminal domain of Suz12. Through this domain, Ctbp2 competes with Jarid2, inhibiting the function of PRC2. Thus, the phosphorylation of Ctbp2 under stress conditions represents a precise mechanism aimed at preserving stemness traits by inhibiting permanent transcriptional shutdown.
© The Author(s) 2024. Published by Oxford University Press on behalf of Nucleic Acids Research.
Product Citations: 86
In Nucleic Acids Research on 11 December 2024 by Lee, H. T., Kim, Y. A., et al.
-
Biochemistry and Molecular biology
-
Genetics
-
Stem Cells and Developmental Biology
In Neuroscience Bulletin on 1 October 2023 by Zhang, M., Zhang, Y., et al.
The histone methyltransferase enhancer of zeste 2 polycomb repressive complex 2 subunit (EZH2)-mediated trimethylation of histone H3 lysine 27 (H3K27me3) regulates neural stem cell proliferation and fate specificity through silencing different gene sets in the central nervous system. Here, we explored the function of EZH2 in early post-mitotic neurons by generating a neuron-specific Ezh2 conditional knockout mouse line. The results showed that a lack of neuronal EZH2 led to delayed neuronal migration, more complex dendritic arborization, and increased dendritic spine density. Transcriptome analysis revealed that neuronal EZH2-regulated genes are related to neuronal morphogenesis. In particular, the gene encoding p21-activated kinase 3 (Pak3) was identified as a target gene suppressed by EZH2 and H3K27me3, and expression of the dominant negative Pak3 reversed Ezh2 knockout-induced higher dendritic spine density. Finally, the lack of neuronal EZH2 resulted in impaired memory behaviors in adult mice. Our results demonstrated that neuronal EZH2 acts to control multiple steps of neuronal morphogenesis during development, and has long-lasting effects on cognitive function in adult mice.
© 2023. The Author(s).
-
Mus musculus (House mouse)
-
Genetics
-
Neuroscience
STORM Microscopy and Cluster Analysis for PcG Studies.
In Methods in Molecular Biology (Clifton, N.J.) on 22 May 2023 by Martín, L., Castells-Garcia, A., et al.
Advanced microscopy techniques (such as STORM, STED, and SIM) have recently allowed the visualization of biological samples beyond the diffraction limit of light. Thanks to this breakthrough, the organization of molecules can be revealed within single cells as never before.Here, we describe the application of STochastic Optical Reconstruction Microscopy (STORM) for the study of polycomb group of proteins (PcG) in the context of chromatin organization. We present a clustering algorithm to quantitatively analyze the spatial distribution of nuclear molecules (e.g., EZH2 or its associated chromatin mark H3K27me3) imaged by 2D STORM. This distance-based analysis uses x-y coordinates of STORM localizations to group them into "clusters." Clusters are classified as singles if isolated or into islands if they form a group of closely associated clusters. For each cluster, the algorithm calculates the number of localizations, the area, and the distance to the closest cluster.This approach can be used for every type of adherent cell line and allows the imaging of every protein for which an antibody is available. It represents a comprehensive strategy to visualize and quantify how PcG proteins and related histone marks organize in the nucleus at nanometric resolution.
© 2023. The Author(s), under exclusive license to Springer Science+Business Media, LLC, part of Springer Nature.
-
Biochemistry and Molecular biology
In Anticancer Research on 1 April 2023 by Ganesh, D., Dafar, A., et al.
The EZH2 complex is involved in cellular proliferation and modulates the immune response in cancer. Less is known about the importance of EZH2 in precancerous lesions such as oral leukoplakia (OL). The aim of the study was to explore the association between EZH2 expression, immune activation, and cancer transformation in OL.
Analyses were retrospectively performed on nine OL cases that had undergone transformation to oral squamous cell carcinoma (OSCC; OL-ca) and nine that had not undergone transformation (OL-non). EZH2-expressing cells, CD3+ and CD8+ T cells, and CD1a+ Langerhans cells were visualized with immunohistofluorescence and counted.
A moderate positive correlation between CD3- and EZH2-expressing and CD8- and EZH2-expressing cells in the epithelium was found (r=0.57, p=0.01; r=0.59, p=0.01). The number of EZH2-expressing cells in the epithelium of OL-ca was significantly higher compared to OL-non (p=0.0002). Cancer-free survival rates differed significantly between patients with EZH2high compared to EZH2low expression (p=0.001). EZH2high expression in OL epithelium was associated with a 13-fold higher risk for developing OSCC (HR=12.8).
EZH2 expression in oral epithelium predicts OSCC transformation of OL and correlates with the level of T-cell infiltration.
Copyright © 2023 International Institute of Anticancer Research (Dr. George J. Delinasios), All rights reserved.
-
Homo sapiens (Human)
-
Cancer Research
-
Immunology and Microbiology
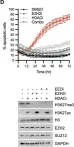
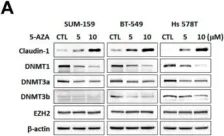
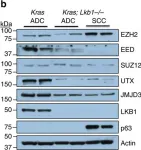
In PLoS Biology on 1 April 2023 by Schade, A. E., Kuzmickas, R., et al.
While screening and early detection have reduced mortality from prostate cancer, castration-resistant disease (CRPC) is still incurable. Here, we report that combined EZH2/HDAC inhibitors potently kill CRPCs and cause dramatic tumor regression in aggressive human and mouse CRPC models. Notably, EZH2 and HDAC both transmit transcriptional repressive signals: regulating histone H3 methylation and histone deacetylation, respectively. Accordingly, we show that suppression of both EZH2 and HDAC are required to derepress/induce a subset of EZH2 targets, by promoting the sequential demethylation and acetylation of histone H3. Moreover, we find that the induction of one of these targets, ATF3, which is a broad stress response gene, is critical for the therapeutic response. Importantly, in human tumors, low ATF3 levels are associated with decreased survival. Moreover, EZH2- and ATF3-mediated transcriptional programs inversely correlate and are most highly/lowly expressed in advanced disease. Together, these studies identify a promising therapeutic strategy for CRPC and suggest that these two major epigenetic regulators buffer prostate cancers from a lethal response to cellular stresses, thereby conferring a tractable therapeutic vulnerability.
Copyright: © 2023 Schade et al. This is an open access article distributed under the terms of the Creative Commons Attribution License, which permits unrestricted use, distribution, and reproduction in any medium, provided the original author and source are credited.
-
WB
-
Cancer Research
-
Genetics
In PLoS Biol on 1 April 2023 by Schade, A. E., Kuzmickas, R., et al.
Fig.1.D

-
WB
-
Collected and cropped from PLoS Biol by CiteAb, provided under a CC-BY license
Image 1 of 37
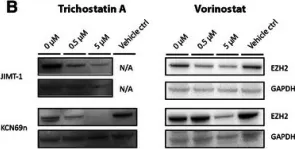
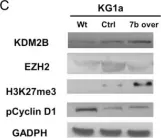
In Cancers (Basel) on 8 November 2019 by Chiang, S. K., Chang, W. C., et al.
Fig.7.A

-
WB
-
Homo sapiens (Human)
Collected and cropped from Cancers (Basel) by CiteAb, provided under a CC-BY license
Image 1 of 37
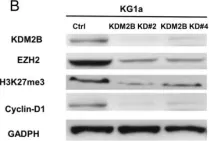
In Cancers (Basel) on 8 November 2019 by Chiang, S. K., Chang, W. C., et al.
Fig.7.B

-
WB
-
Homo sapiens (Human)
Collected and cropped from Cancers (Basel) by CiteAb, provided under a CC-BY license
Image 1 of 37
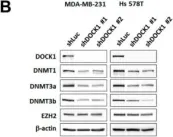
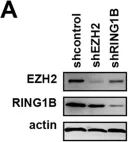
In Nat Commun on 7 April 2017 by Zhang, H., Fillmore Brainson, C., et al.
Fig.3.B

-
WB
-
Mus musculus (House mouse)
Collected and cropped from Nat Commun by CiteAb, provided under a CC-BY license
Image 1 of 37
In BMC Cancer on 12 April 2015 by Nordström, L., Andersson, E., et al.
Fig.6.B

-
WB
-
Collected and cropped from BMC Cancer by CiteAb, provided under a CC-BY license
Image 1 of 37
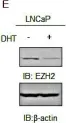
In Oncotarget on 10 February 2015 by Takayama, K., Suzuki, T., et al.
Fig.6.E

-
WB
-
Collected and cropped from Oncotarget by CiteAb, provided under a CC-BY license
Image 1 of 37
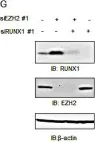
In Oncotarget on 10 February 2015 by Takayama, K., Suzuki, T., et al.
Fig.5.G

-
WB
-
Collected and cropped from Oncotarget by CiteAb, provided under a CC-BY license
Image 1 of 37
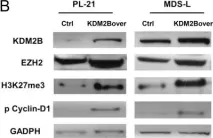
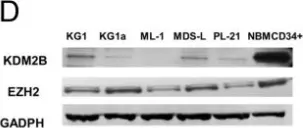
In PLoS One on 17 September 2014 by Karoopongse, E., Yeung, C., et al.
Fig.3.B

-
WB
-
Homo sapiens (Human)
Collected and cropped from PLoS One by CiteAb, provided under a CC-BY license
Image 1 of 37
In PLoS One on 17 September 2014 by Karoopongse, E., Yeung, C., et al.
Fig.1.D

-
WB
-
Homo sapiens (Human)
Collected and cropped from PLoS One by CiteAb, provided under a CC-BY license
Image 1 of 37
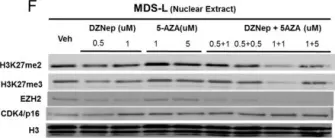
In PLoS One on 17 September 2014 by Karoopongse, E., Yeung, C., et al.
Fig.5.F

-
WB
-
Homo sapiens (Human)
Collected and cropped from PLoS One by CiteAb, provided under a CC-BY license
Image 1 of 37
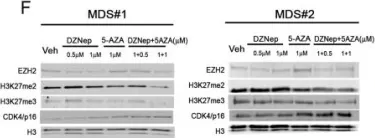
In PLoS One on 17 September 2014 by Karoopongse, E., Yeung, C., et al.
Fig.6.F

-
WB
-
Homo sapiens (Human)
Collected and cropped from PLoS One by CiteAb, provided under a CC-BY license
Image 1 of 37
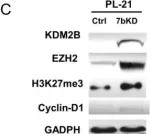
In PLoS One on 17 September 2014 by Karoopongse, E., Yeung, C., et al.
Fig.3.C

-
WB
-
Homo sapiens (Human)
Collected and cropped from PLoS One by CiteAb, provided under a CC-BY license
Image 1 of 37
In PLoS One on 17 September 2014 by Karoopongse, E., Yeung, C., et al.
Fig.4.C

-
WB
-
Homo sapiens (Human)
Collected and cropped from PLoS One by CiteAb, provided under a CC-BY license
Image 1 of 37
In PLoS One on 17 September 2014 by Karoopongse, E., Yeung, C., et al.
Fig.4.B

-
WB
-
Homo sapiens (Human)
Collected and cropped from PLoS One by CiteAb, provided under a CC-BY license
Image 1 of 37
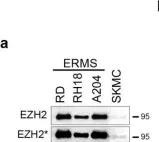
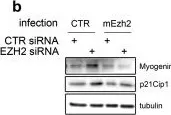
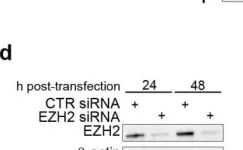
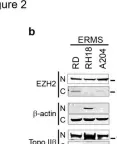
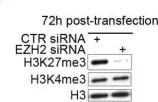
In BMC Cancer on 27 February 2014 by Ciarapica, R., Carcarino, E., et al.
Fig.2.A

-
WB
-
Collected and cropped from BMC Cancer by CiteAb, provided under a CC-BY license
Image 1 of 37
In BMC Cancer on 27 February 2014 by Ciarapica, R., Carcarino, E., et al.
Fig.5.B

-
WB
-
Collected and cropped from BMC Cancer by CiteAb, provided under a CC-BY license
Image 1 of 37
In BMC Cancer on 27 February 2014 by Ciarapica, R., Carcarino, E., et al.
Fig.4.B

-
WB
-
Collected and cropped from BMC Cancer by CiteAb, provided under a CC-BY license
Image 1 of 37
In BMC Cancer on 27 February 2014 by Ciarapica, R., Carcarino, E., et al.
Fig.2.D

-
WB
-
Collected and cropped from BMC Cancer by CiteAb, provided under a CC-BY license
Image 1 of 37
In BMC Cancer on 27 February 2014 by Ciarapica, R., Carcarino, E., et al.
Fig.2.B

-
WB
-
Collected and cropped from BMC Cancer by CiteAb, provided under a CC-BY license
Image 1 of 37
In BMC Cancer on 27 February 2014 by Ciarapica, R., Carcarino, E., et al.
Fig.2.E

-
WB
-
Collected and cropped from BMC Cancer by CiteAb, provided under a CC-BY license
Image 1 of 37
In PLoS Pathog on 25 December 2013 by Toth, Z., Brulois, K., et al.
Fig.6.A

-
WB
-
Homo sapiens (Human)
Collected and cropped from PLoS Pathog by CiteAb, provided under a CC-BY license
Image 1 of 37
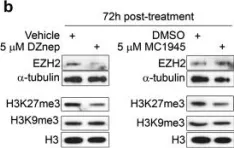
In Int J Mol Sci on 12 December 2013 by Vella, S., Gnani, D., et al.
Fig.1.D

-
WB
-
Collected and cropped from Int J Mol Sci by CiteAb, provided under a CC-BY license
Image 1 of 37
In Int J Mol Sci on 12 December 2013 by Vella, S., Gnani, D., et al.
Fig.2.M

-
WB
-
Collected and cropped from Int J Mol Sci by CiteAb, provided under a CC-BY license
Image 1 of 37
In Int J Mol Sci on 12 December 2013 by Vella, S., Gnani, D., et al.
Fig.3.E

-
WB
-
Collected and cropped from Int J Mol Sci by CiteAb, provided under a CC-BY license
Image 1 of 37
In BMC Genomics on 4 April 2013 by Greussing, R., Hackl, M., et al.
Fig.4.B

-
WB
-
Collected and cropped from BMC Genomics by CiteAb, provided under a CC-BY license
Image 1 of 37